Data Quality
A QPI — Quality Performance Indicator — is a named check that runs SQL against the client warehouse and returns a pass/fail verdict with a message and a measured value. Two pages cover them: the Monitor reads, the Administration page writes.
A QPI run can complete perfectly and still report a failing check — that is exactly what a QPI is for. The pass/fail verdict comes from the probe's own test column, never from whether the run succeeded. Keep the two apart when reading these pages.
QPI Monitor
Read-only. Scoped to the sidebar date range, with a Max records slider.
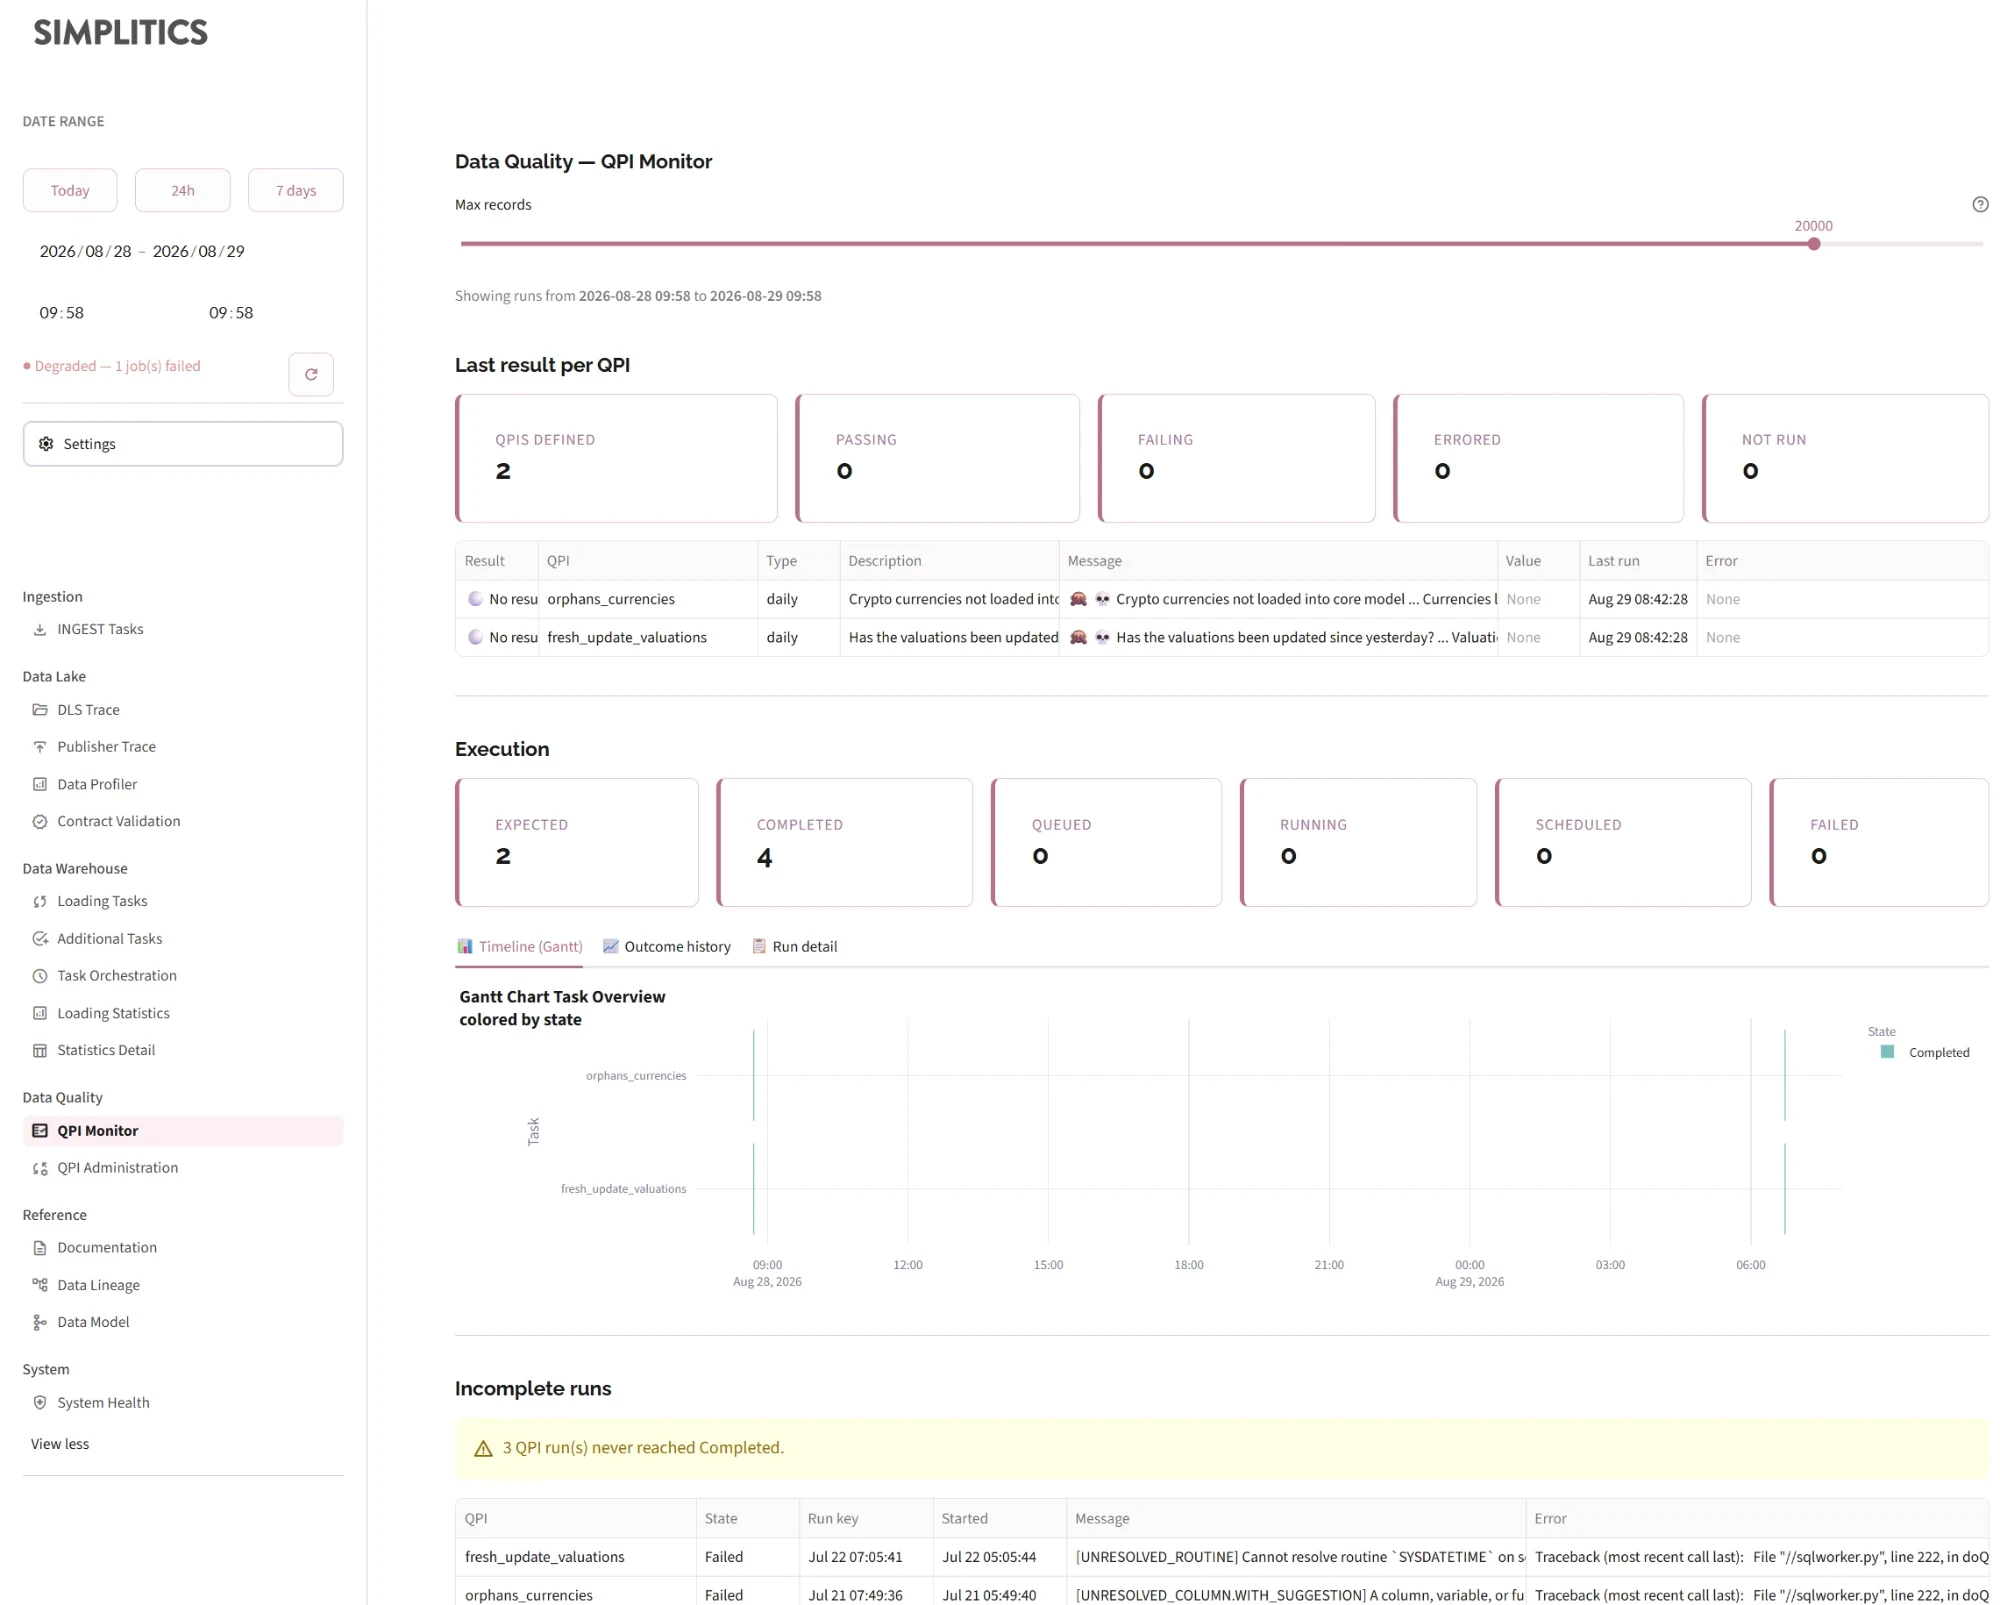
Last result per QPI
The headline. Every defined QPI, joined to the most recent run inside the window, so a check that never ran shows as a gap rather than vanishing.
| Outcome | Meaning |
|---|---|
| 🟢 Pass | The run completed and the probe returned test = 1 |
| 🟠 Fail | The run completed and the probe returned test = 0 — the data is wrong |
| 🔴 Error | The run failed — the probe SQL itself raised an error |
| ⚪ Not run | No run inside the window |
Counters across the top (QPIs defined, Passing, Failing, Errored, Not run) are followed by an alert per condition, then the full table: outcome, QPI, type, description, message, value, last run, error.
Fail and Error need different responses. A Fail is a data problem — go and look at the data. An Error is a broken check — go and fix the SQL on the Administration page.
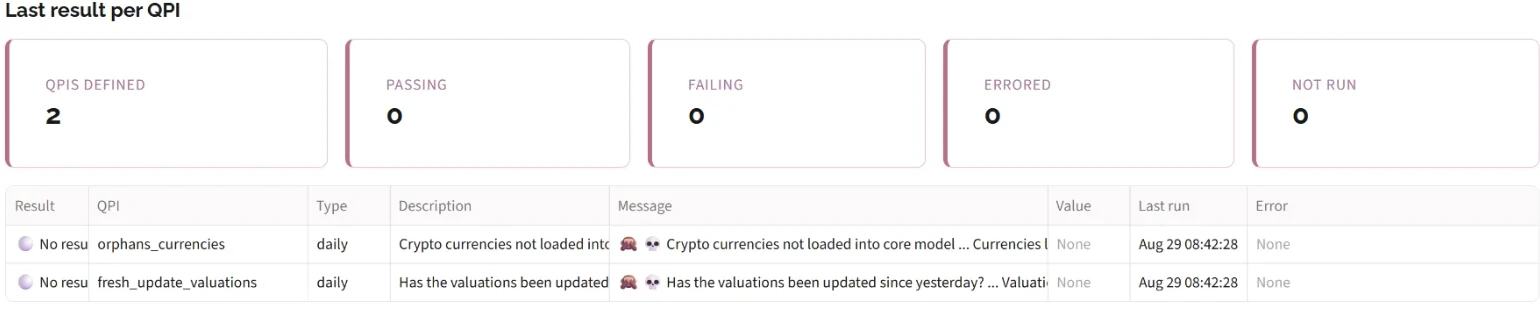
Execution
State metrics, then three tabs:
- Timeline (Gantt) — when each run started and how long it took. A run still in flight is drawn up to now so it has a visible bar.
- Outcome history — runs per QPI in the window, coloured by outcome. This is where a flapping check becomes obvious: a QPI alternating pass and fail between runs is a different problem from one that is steadily failing.
- Run detail — the raw run table with a filter builder
Incomplete runs
Runs that never reached Completed, read from a dedicated status endpoint so the list is complete regardless of the page's window or record limit.
Admins get an Admin console here with two actions per stuck run:
| Action | Effect |
|---|---|
| ⏹ Terminate | Closes the run as Completed, marked terminated, against its run key |
| 🔄 Rerun | Terminates the run, then queues a fresh one immediately |
A run is identified by (qpi, runDttm). If the worker dies mid-probe, that row stays Running forever and blocks the check. Terminating closes it as Completed rather than Failed — a Failed run still counts as incomplete and would linger in the list.
Dependency graph and schedule checklist
The graph shows what each QPI waits on, with QPI nodes carrying their last known result. The checklist below lists every definition with its frequency, interval, earliest runtime, last and next run, dependencies and description.
QPI Administration
Everything that changes a QPI. All mutating actions are admin-only and audit-logged; other roles see the page read-only behind a lock notice.
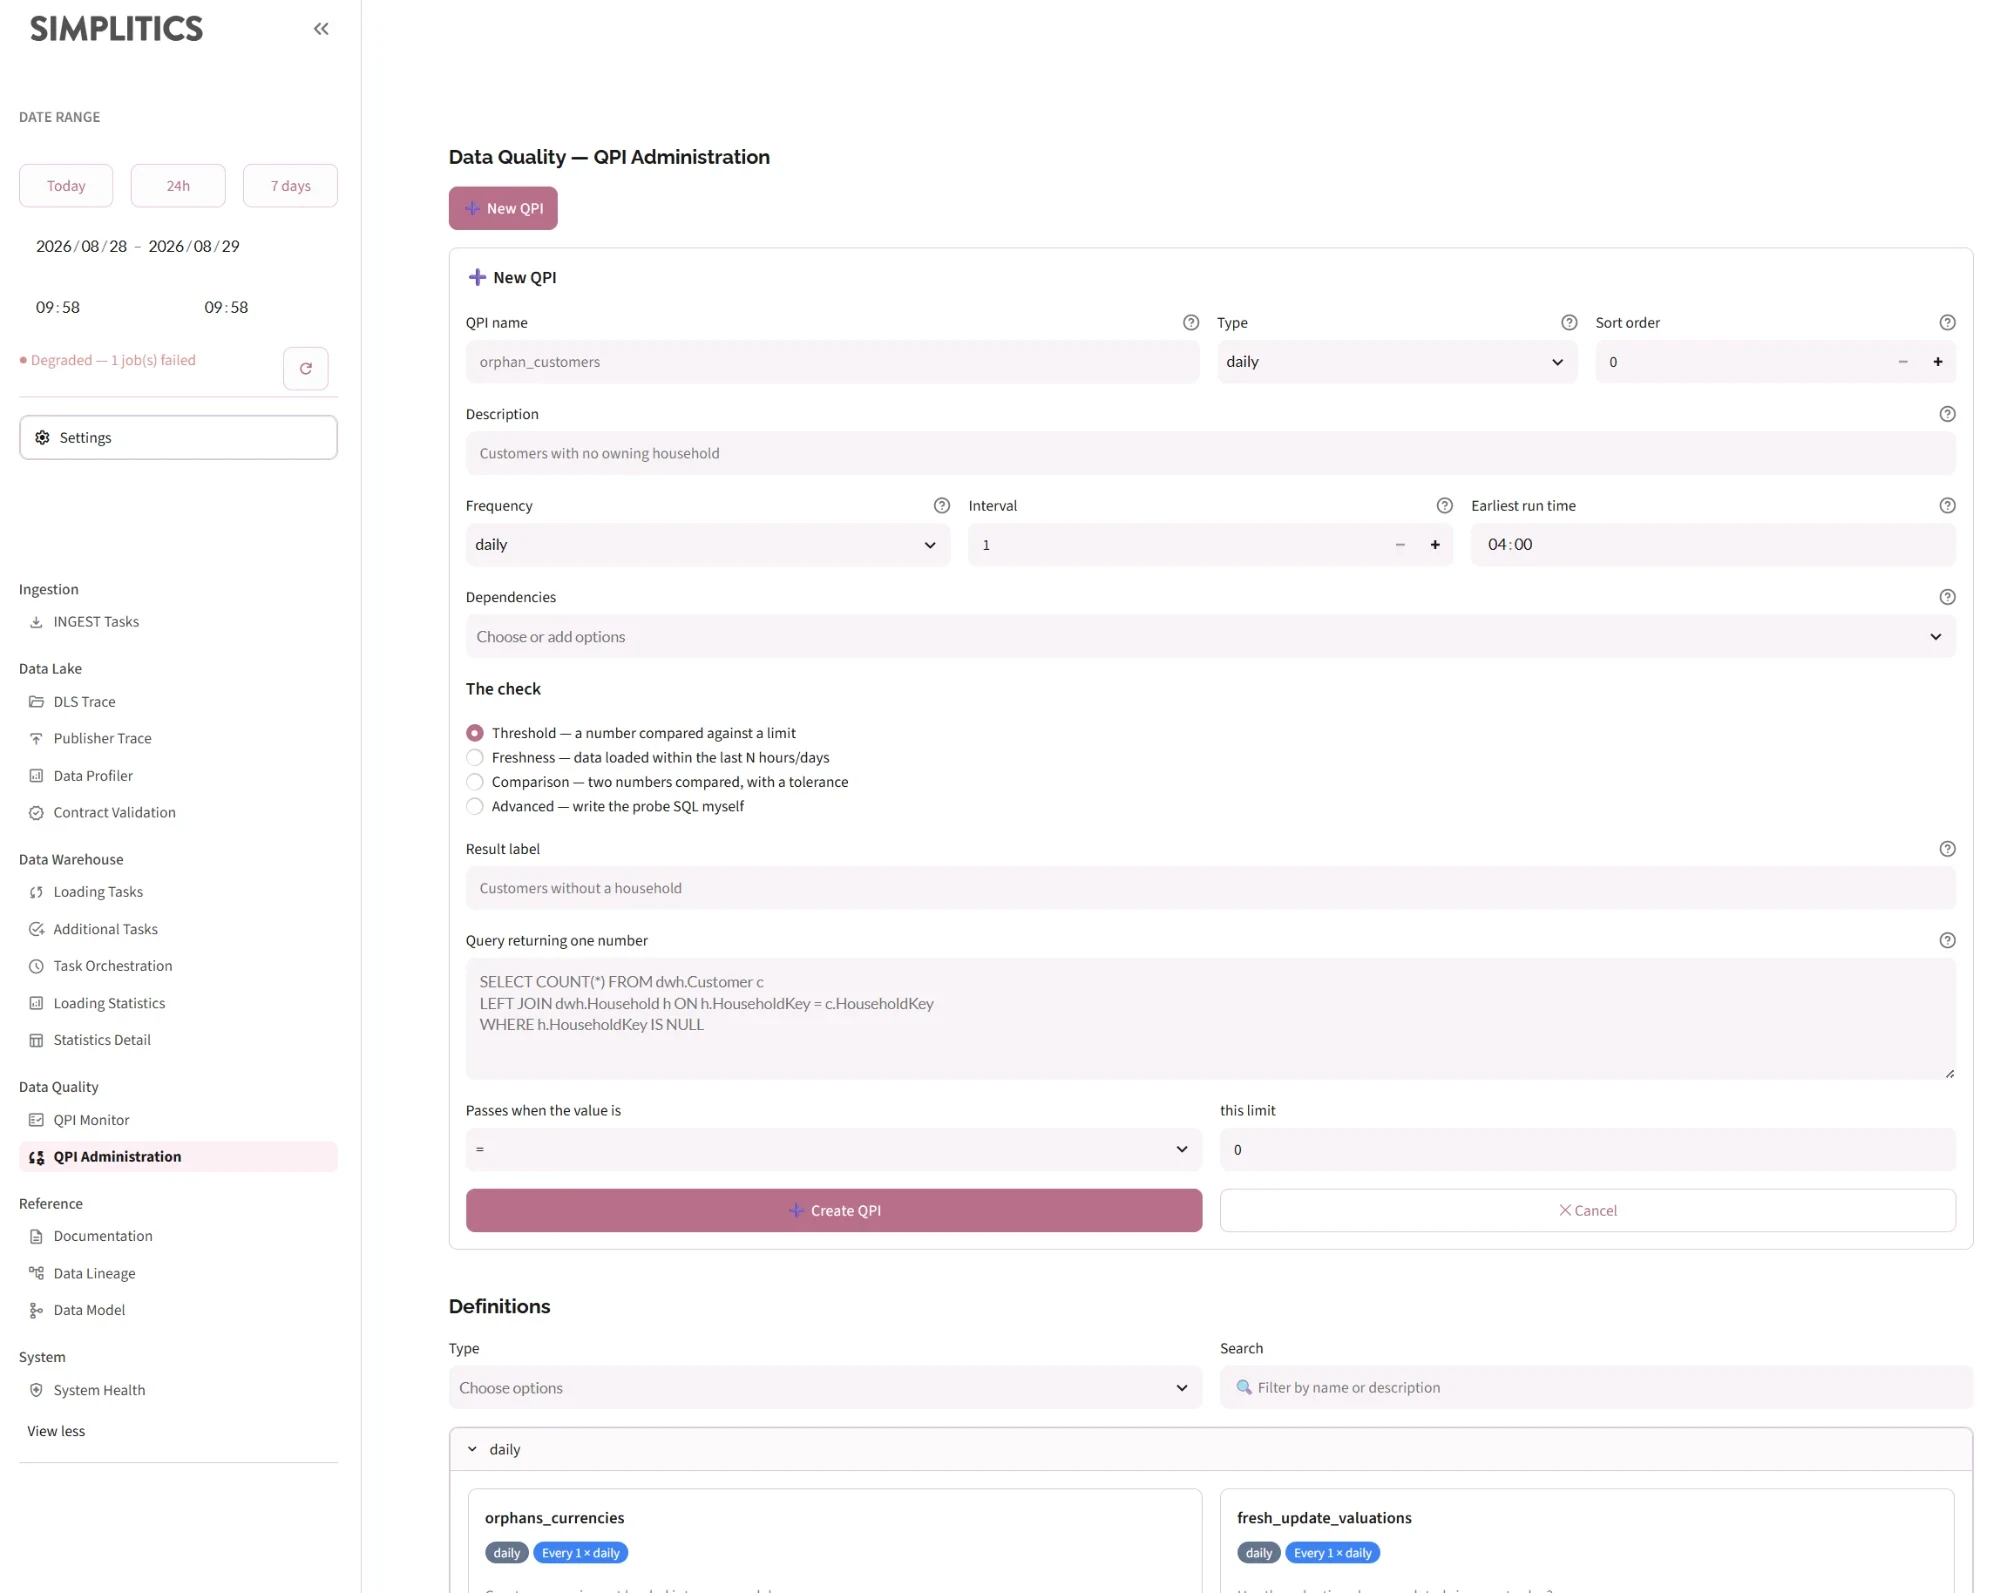
Definitions
One card per QPI, grouped by type into expanders, filterable by type and by a name/description search. Each card shows its type badge, its schedule (or a Retired badge), description, last run, next run and dependencies, with three actions: ▶ Run now, ✏️ Edit, and delete — each confirmed inline. Editing opens a form directly below the card's row.
The definition form
| Field | Notes |
|---|---|
| QPI name | The identifier. Cannot be changed after creation. |
| Type | Free-form grouping; a whole type can be triggered as a batch |
| Sort order | The order checks run and are reported in |
| Description | Shown in the run report next to the pass/fail marker |
| Frequency | How often the scheduler runs it. never retires it — the definition and its history are kept, but the scheduler stops picking it up. |
| Interval | Run every N frequency cycles |
| Earliest run time | No run is scheduled before this time of day |
| Dependencies | Flows the check waits on. When one completes, its dependent QPIs are triggered. |
Retiring with never is the right way to stop a check you may want back. Deleting is for definitions that were a mistake.
The check
Either a guided builder or Advanced raw SQL. The guided builder always shows the SQL it generates, in a Generated probe SQL expander — the console never sends something you have not been shown. Switching a guided check to Advanced hands you the SQL to hand-tune; switching back replaces it.
A QPI whose SQL was not produced by the builder opens directly in Advanced mode.
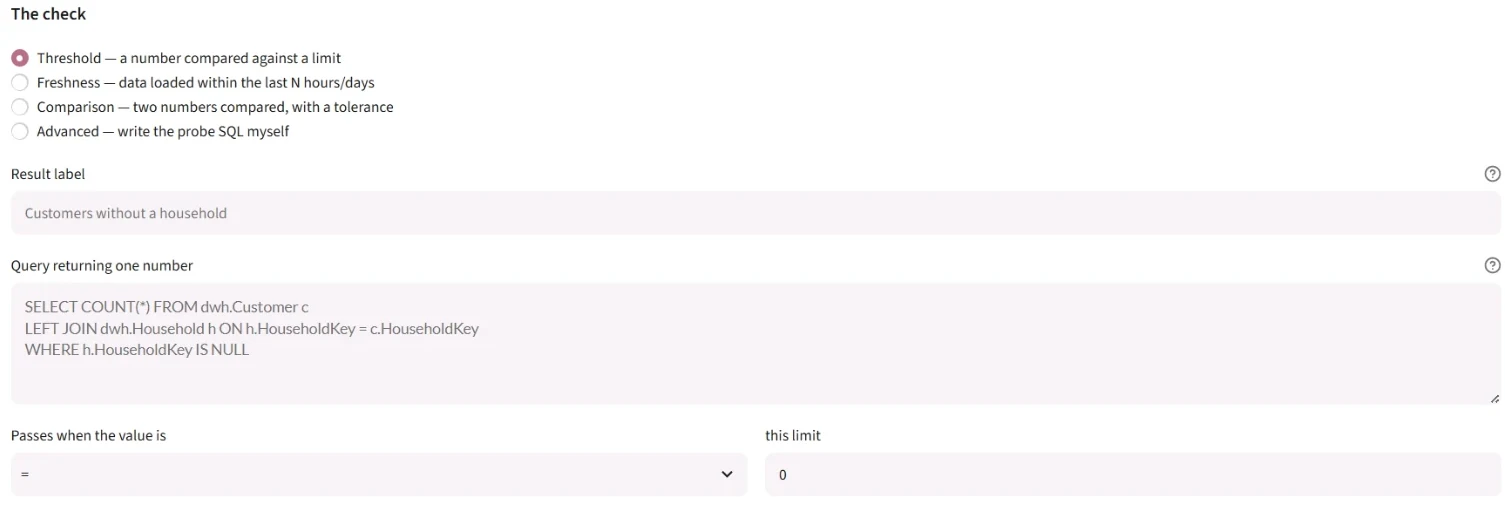
The probe SQL contract
The worker runs the SQL against the client warehouse and reads the first row's first three columns, in order:
| # | Column | Meaning |
|---|---|---|
| 1 | test | The verdict. 1 = pass, 0 = fail. Must be a number. |
| 2 | message | Human-readable text shown in the run report |
| 3 | value | The measured number, as text |
Name the columns exactly, aliasing them where they come from expressions, and write the query so it always returns exactly one row — aggregate with COUNT(*) rather than returning the offending rows, or only the first is read and the rest are silently ignored.
The API rejects a command that does not end with exactly one ;, or that contains INSERT, UPDATE, DELETE, MERGE, DROP, TRUNCATE, ALTER, CREATE or EXEC. A probe reads; it never writes.
An example that passes when no orphaned customers exist:
SELECT
    CASE WHEN COUNT(*) = 0 THEN 1 ELSE 0 END AS test,
    CONCAT(CAST(COUNT(*) AS VARCHAR), ' customers without a household') AS message,
    CAST(COUNT(*) AS VARCHAR) AS value
FROM dwh.Customer c
LEFT JOIN dwh.Household h ON h.HouseholdKey = c.HouseholdKey
WHERE h.HouseholdKey IS NULL;
Zero orphans → test = 1 → 🟢 Pass. Any orphans → test = 0 → 🟠 Fail, with the count carried in message and value.
Pre-check before saving
The console runs the API's rules locally before the round trip and separates them:
- Blocking — the same rules the API enforces: terminator count, mutating keywords. These stop the save.
- Advisory — heuristics that cannot be decided by inspection: the query does not start with
SELECT/WITH, or notest/message/valuecolumn was found. These warn but never block.
String literals and comments are blanked before keyword scanning, so a probe whose message reads "please update the source" is not mistaken for an UPDATE statement.
Whatever fails, your input stays on screen to be corrected — nothing is discarded.
Stuck runs
The same force-close facility as the Monitor's admin console, listing every incomplete run with its state, start time and error, and a Terminate action per run.
Dependencies
Pick a source flow to see which QPIs it gates, then trigger them all as if the flow had just completed. This is the fix for a missed completion signal — the flow ran, but its dependent checks were never woken.