System Health
The default landing page. It answers a different question from the pipeline pages: not did the data arrive, but are the services themselves running, and what did they say.
Everything on the page is scoped to the sidebar date range.
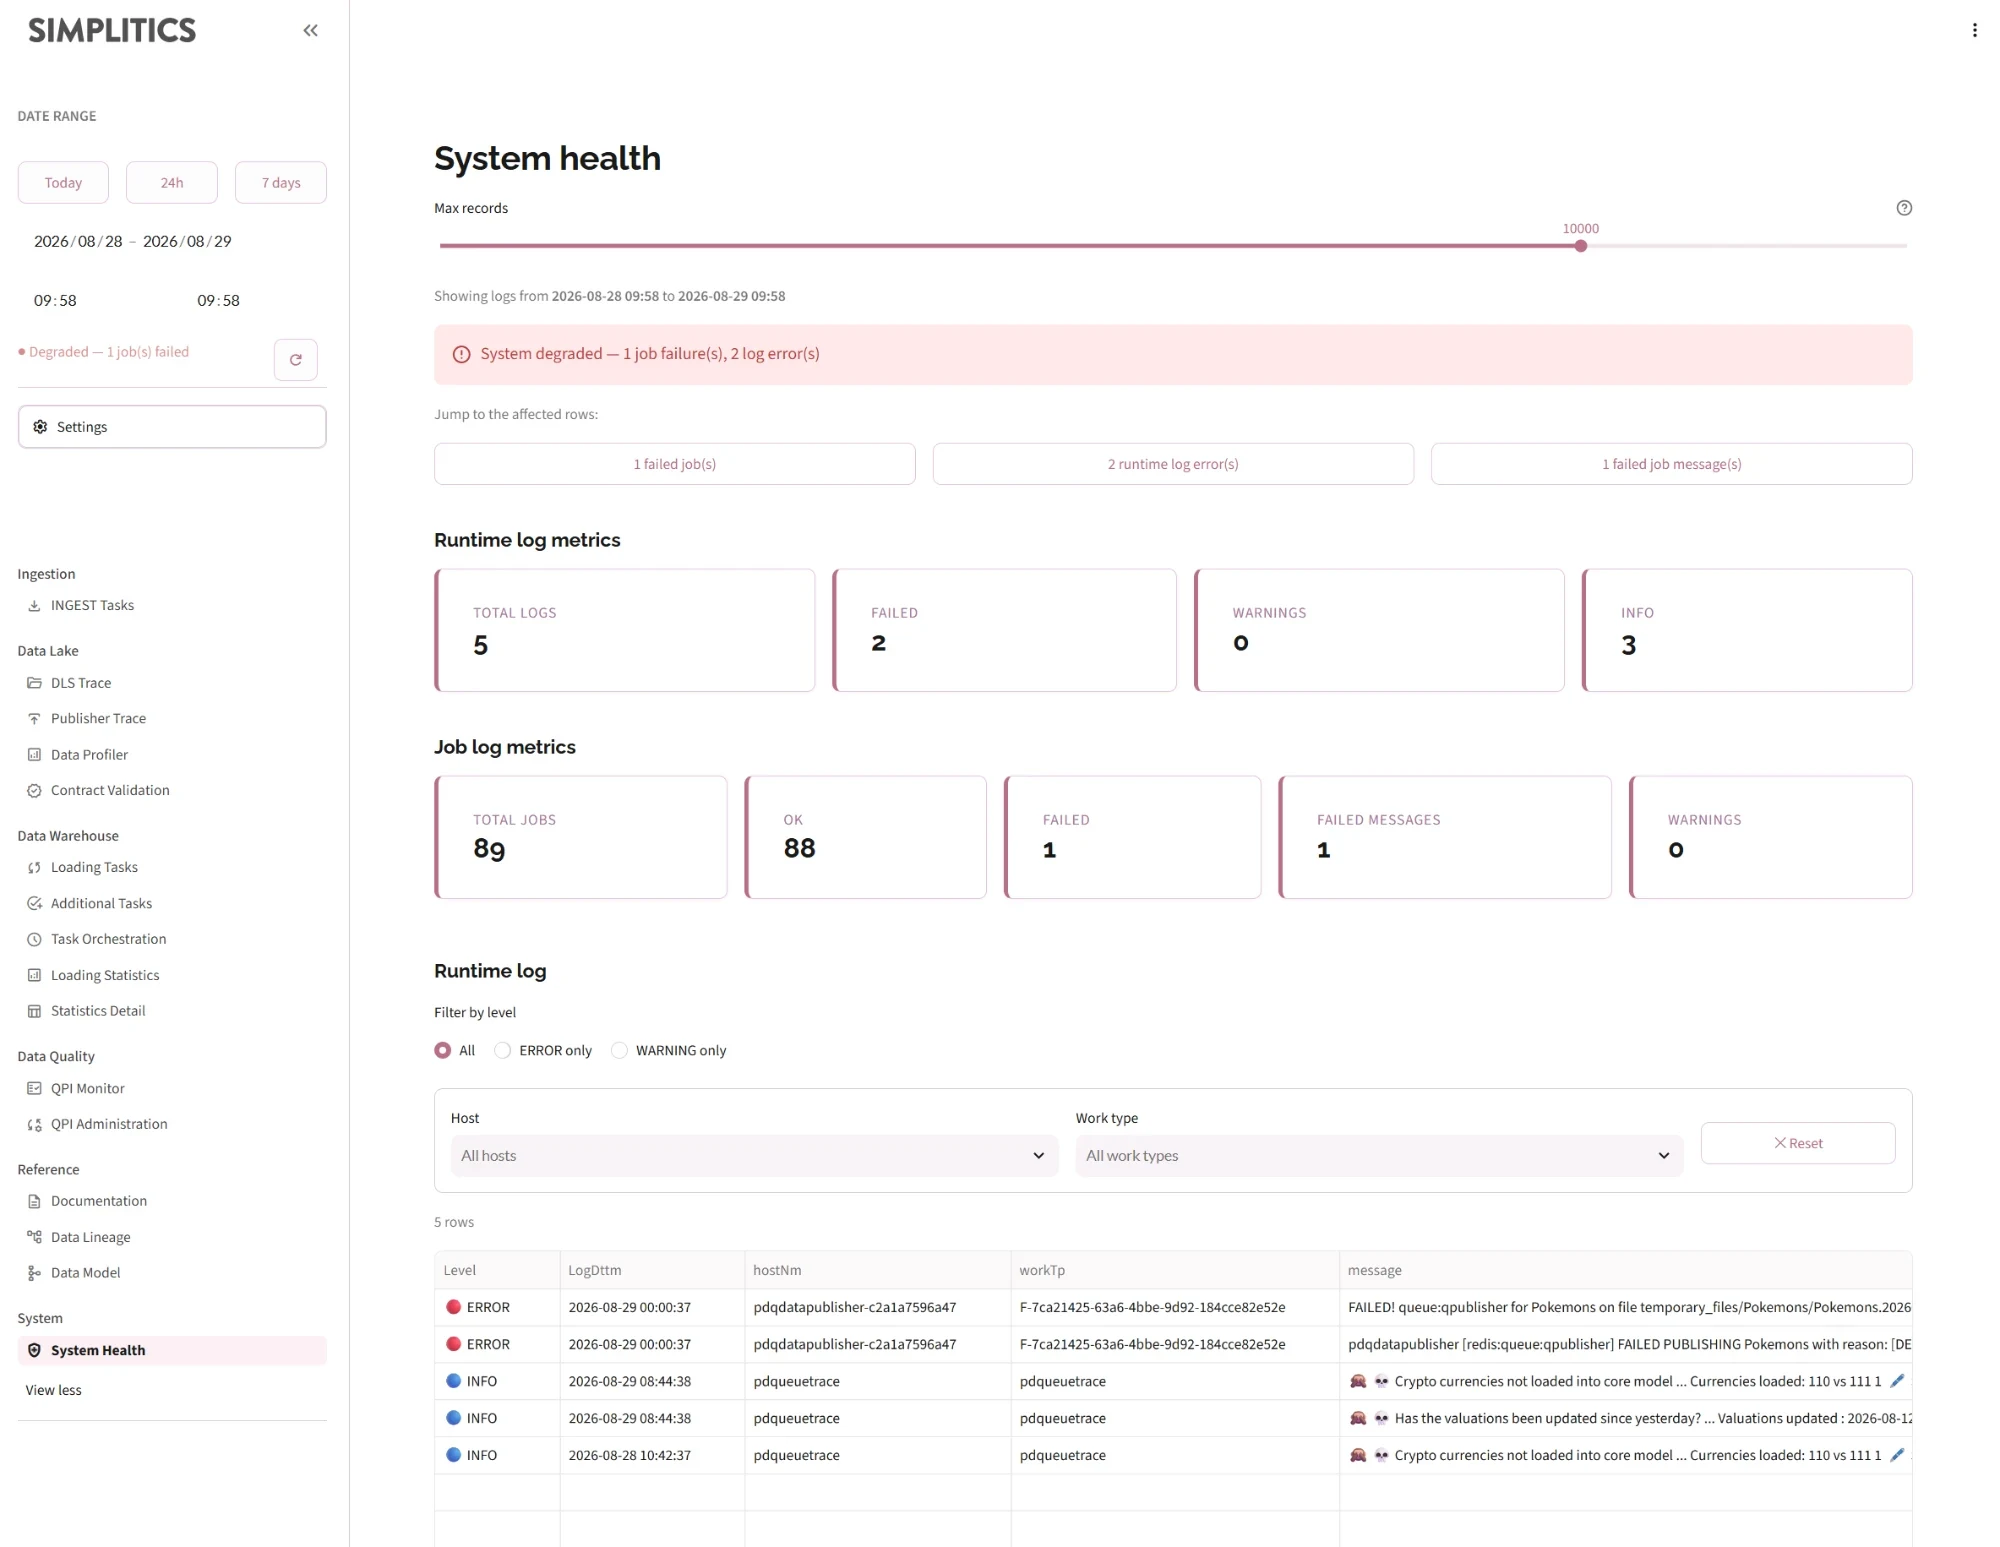
Max records
A slider above the page content caps how many log rows are fetched from the repository (1 → 100,000, default 10,000). Lower it if the page is slow on a wide window; raise it if a busy window looks truncated.
The health banner
One banner, at the top, is the page's only alert. It carries the server-computed verdict:
| Verdict | Shown when |
|---|---|
| Healthy | No failures detected in the window |
| Warning | Runtime log errors, failed job messages, or warnings — but no failed jobs |
| Degraded | At least one job failed |
Under the banner is a row of buttons, one per problem found — "3 failed job(s)", "12 runtime log error(s)", "2 job warning(s)". Clicking one pre-filters the relevant table below and scrolls to it. This is the intended way to work the page: read the banner, click the problem, land on the rows.
The sections below the banner are deliberately neutral in colour. Repeating the same failure as a red box next to every metric made it impossible to see where to look first.

Metrics
Two rows of counters, both server-computed with a client-side fallback:
- Runtime log metrics — Total logs, Failed, Warnings, Info
- Job log metrics — Total jobs, OK, Failed, Failed messages, Warnings
Note that Failed jobs and Failed messages are different things. A job can end with status OK while still having logged a message whose text reads as a failure; both are counted, and both get their own jump button in the banner.
Job status overview
A bar chart of jobs by status, with the job failure rate as a percentage beside it (failed / total). Statuses are coloured consistently with the rest of the console — OK green, FAILED red, INIT pale aqua, Running rose, Restarted purple, Scheduled lavender. A status the backend introduces later renders in neutral grey rather than disappearing.
Runtime log
Every runtime log line in the window, sorted errors first, then warnings, then info, and by time within each level.
- A quick radio filter: All / ERROR only / WARNING only
- Multiselect filters for Host and Work type, with a Reset button
- Columns: Level, time, host, work type, message
Severity comes from the API where available. When it is missing, the console derives it from the message text: FAILED, ERROR, EXCEPTION, CRITICAL → 🔴 ERROR; WARNING, ALERT, RESTARTING, RETRY → 🟡 WARNING; anything else → 🔵 INFO.
Job log
Every job execution in the window, newest first, with multiselect filters for Status, Severity, Host and Work type, plus a Reset button. Columns include the start and end timestamps and the execution time in seconds — the fastest way to spot a job that completed but took far longer than usual.
What to do with what you find
The page is read-only. It tells you which component failed and what it said; the corrective action lives on the pipeline page that owns the work — restart an extraction on INGEST Tasks, a load step on DWA Loading Tasks, a publish on Publisher Trace.