Reference views
Three pages that do not monitor anything. They explain the platform's configuration and structure, and they are what you reach for when a monitoring page has told you what broke and you need to know what depends on it.
Documentation
Everything configured for one sourcefile, on one page: pick a source system, then a source file.
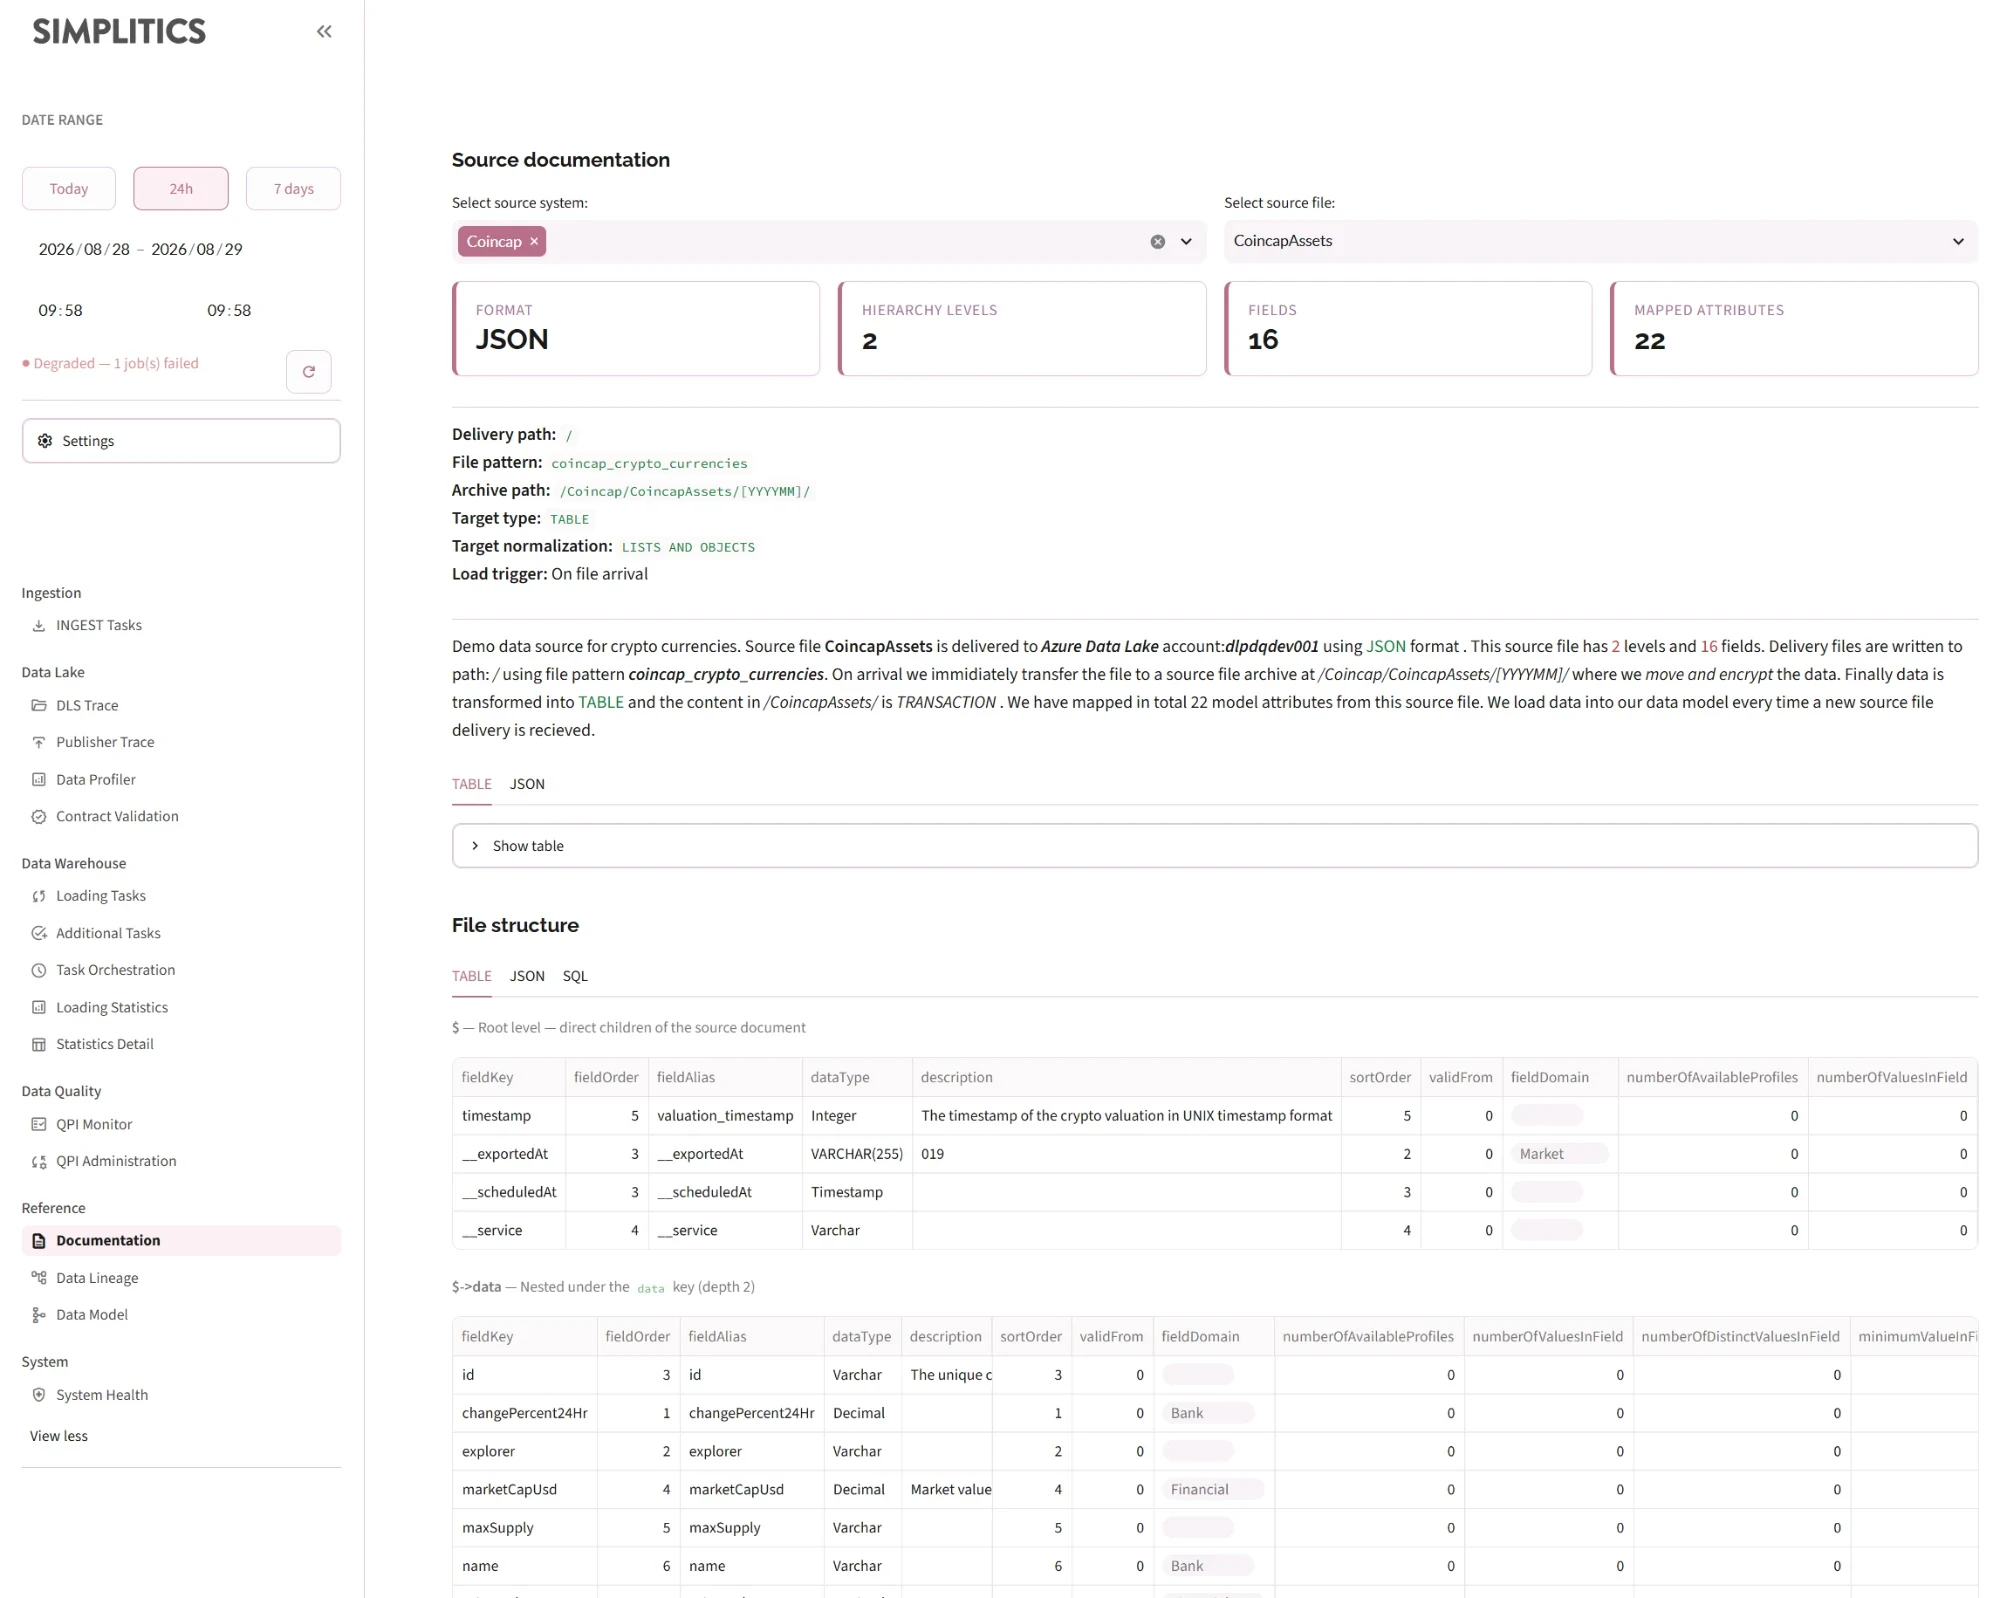
Header
Four metric cards — Format, Hierarchy levels, Fields, Mapped attributes — then the delivery path block:
| Field | Meaning |
|---|---|
| Delivery path | Where the file is expected to land |
| File pattern | The filename pattern it must match |
| Archive path | Where it is archived in the Raw zone |
| Target type / normalisation | How it is written into the warehouse |
| Load trigger | On file arrival, otherwise the cycle and interval |
Below that, a generated prose description of the source, combining the system description, the sourcefile configuration and its schedule.
File structure
The data contract itself, in three tabs:
- TABLE — one table per hierarchy level, with each field's key indicator, key order, exclusion flags and sensitivity flag rendered as checkboxes, alongside sample data for that level
- JSON — the raw contract
- SQL — the generated DDL for the source
Mappings
The source-to-target attribute mappings, grouped by mapping number, with a caption naming the target table and attribute count for each. Columns: source, key mapping flag, key order, use-field-name-as-value, optional calculation, filter, sort order, target. Key mappings sort first. A JSON tab gives the raw form.
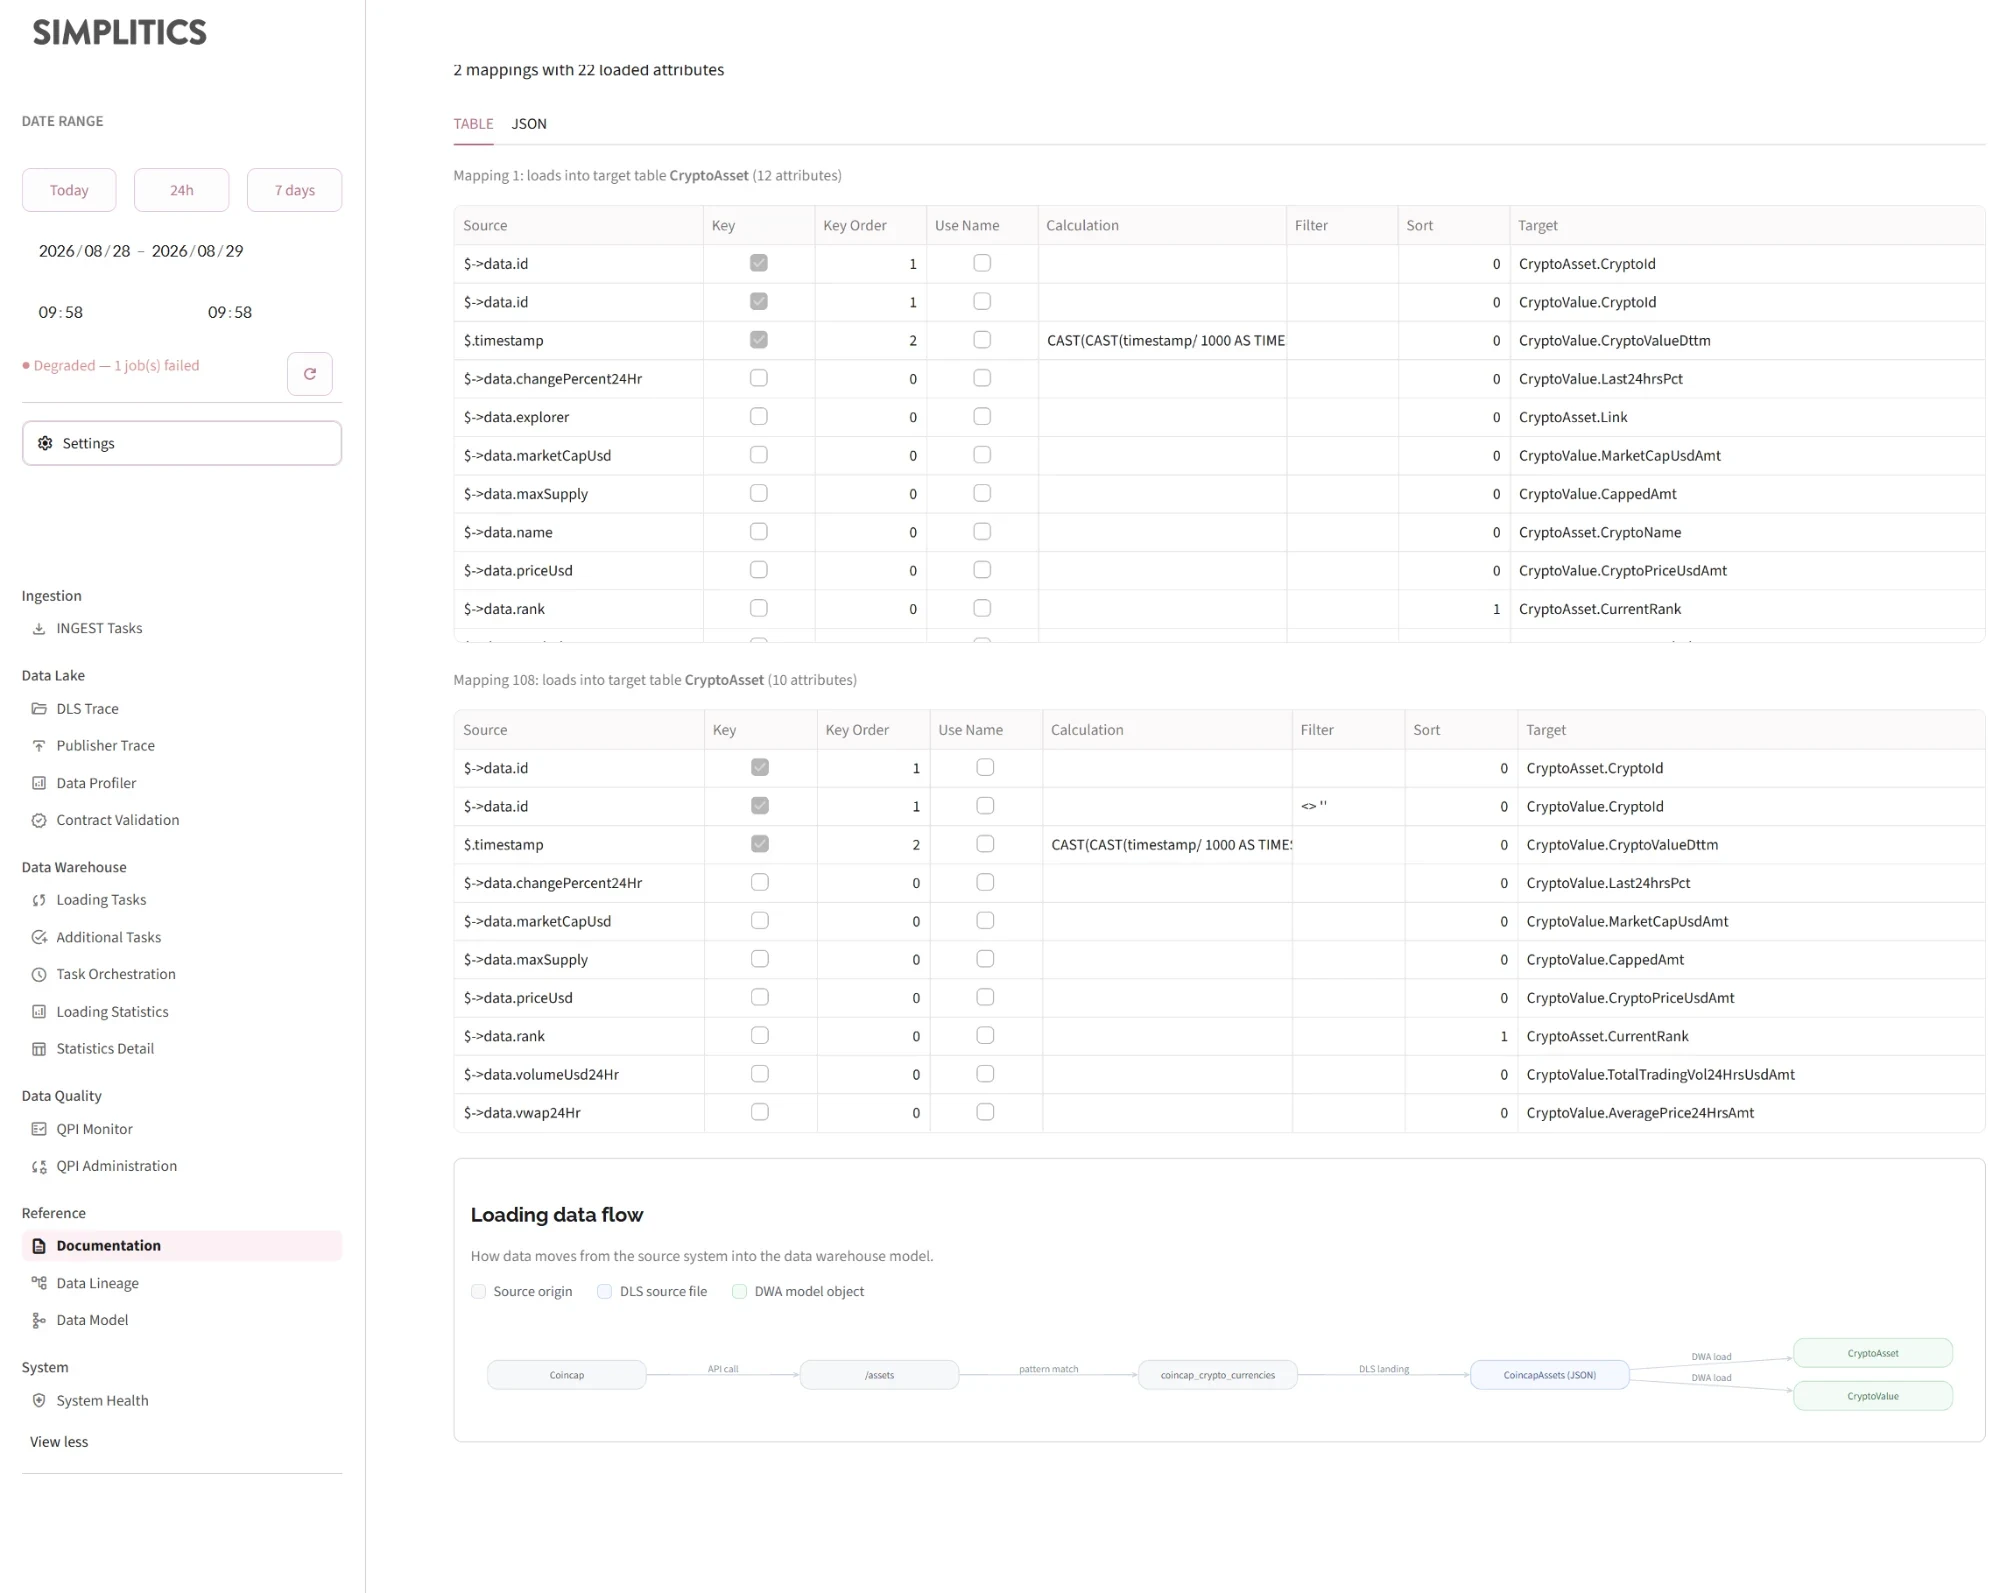
Loading data flow
A diagram of how data moves from the source system, through the API endpoint or database table, into the file, and out to the target model objects — the single-sourcefile view of what Data Lineage shows for the whole platform.
The Contract Validation page links directly here, per sourcefile, so a reported deviation is one click from the contract it deviates from.

Data Lineage
Where does a column come from, and where does it end up? The fastest way to size the blast radius of a change or a failure.
A slider caps how many mappings are loaded (2,000 → 100,000, default 20,000).
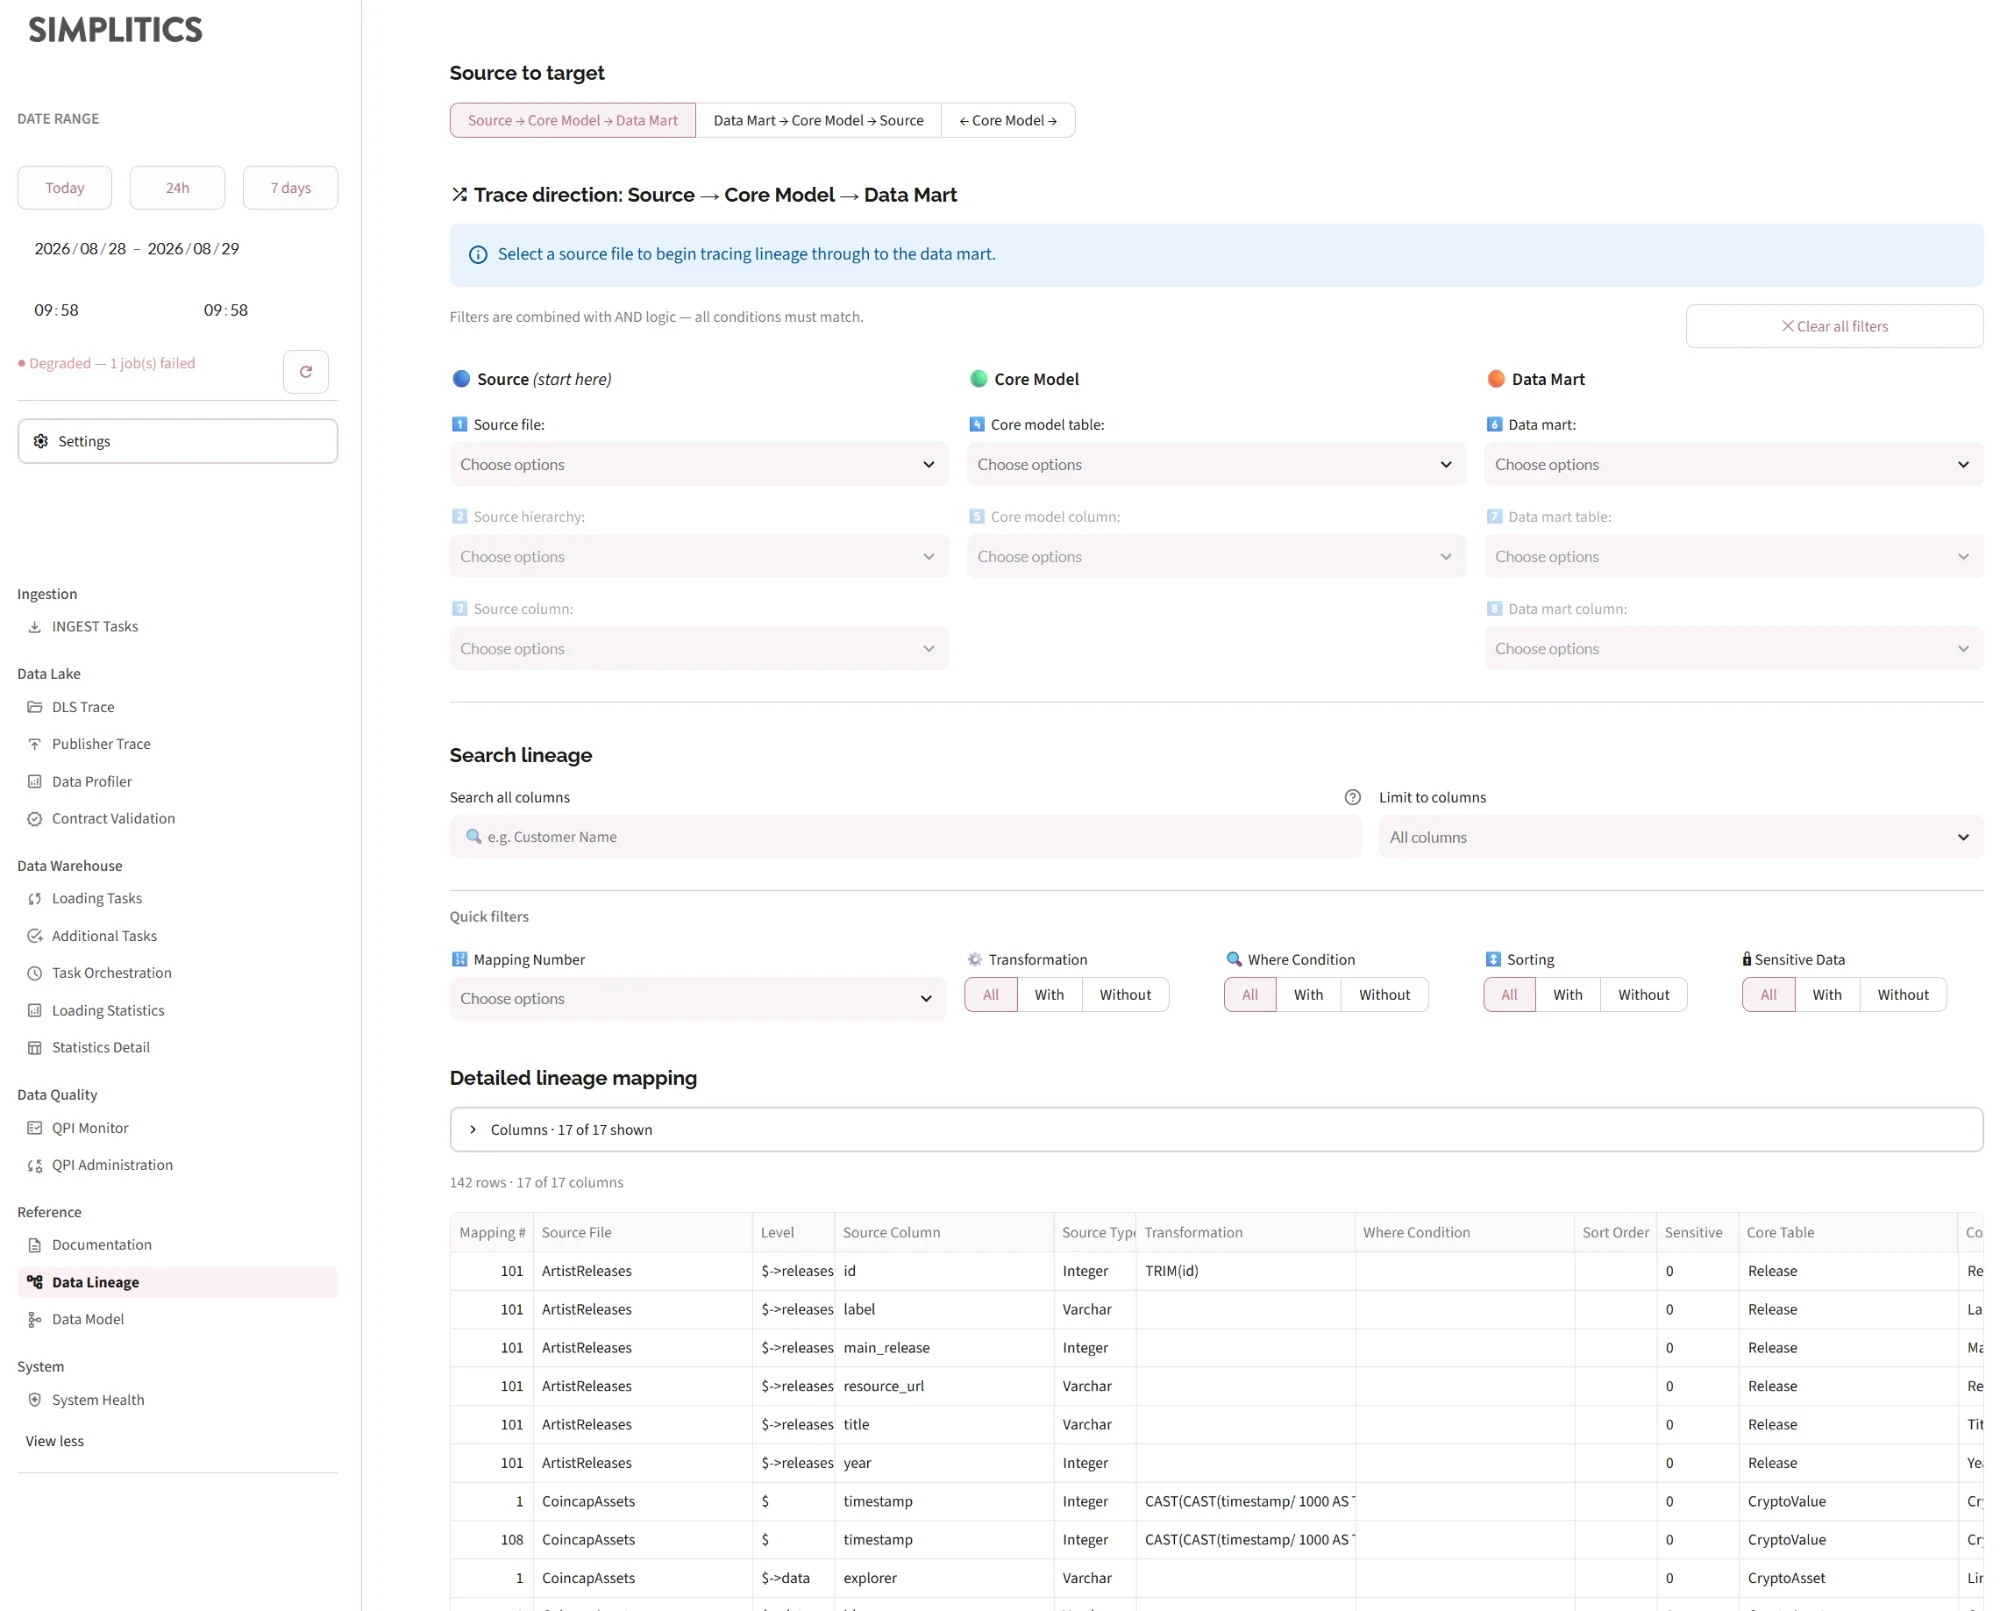
Trace direction
A segmented control picks the direction, and the filter cascade reshapes to match:
| Direction | Start from |
|---|---|
| Source → Core Model → Data Mart | A source file — trace forward to the marts |
| Data Mart → Core Model → Source | A data mart — trace back to the source |
| ← Core Model → | A core model table — explore upstream and downstream at once |
Filters cascade in numbered steps, each narrowing the options of the next, and each disabled until its parent has a selection. Filters combine with AND. Changing direction clears them; Clear all filters resets everything.
Search lineage
Free-text search across every column — names, expressions, conditions and comments — or scoped to chosen columns.
- Several words must all match
"customer name"matches the exact phrase-testexcludes rows containing test
The result reports how many of the total rows matched, and a Where did it match? expander breaks the hits down by column with an example value — useful when a term is spread across several columns rather than concentrated in one.
The search narrows the cascade options too, so the dropdowns only offer values that exist within your hits.
Quick filters
Direction-independent and always visible: Mapping Number, and All / With / Without toggles for Transformation, Where condition, Sorting and Sensitive data.
The sensitive-data filter is the quickest answer to "which mappings carry personal data" — a question that comes up in every audit.
Detailed lineage mapping
The full table, with a column picker offering four presets:
| Preset | Columns |
|---|---|
| All columns | Everything |
| Slim path | Just the source → core → mart chain |
| With data types | The chain plus data types at each level |
| Transformation logic | The chain plus transformation, where condition, sorting and expression |
The picker also shapes what the table's download button writes out.
Lineage overview
A graph of source files → core model tables → data mart tables for the current selection. Above 200 nodes the graph is replaced by a summary table counting core tables and data marts per source file — an unreadable hairball helps no one. Filter down to get the graph back.
Data Model
How the target model hangs together. Pick a subject area (MAIN is preselected when it exists), then show or hide individual entities.
Four tabs:
ER Diagram
A Mermaid entity-relationship diagram of the selected entities, with a toolbar: Show attributes, Fit to screen, and a copy button that reveals the Mermaid definition for pasting elsewhere. A legend derived from the model metadata explains the relationship types present — FK (1:N), FK (N:M), or logical.
Model Object Details
One expander per selected entity listing its attributes, with business keys marked.
Manage Subject Areas
Create a new subject area, or edit an existing one by selecting objects from the model. Saving reports the API response, and the saved area is preselected when the page reloads.
DBML Schema
The model as DBML, ready to paste into a schema visualiser.