The DataOps Console
The DataOps Console is the operator-facing web application for the PDQ platform. It is a monitoring and intervention tool: it shows whether every scheduled ingestion, data lake movement, warehouse load and quality check has run as expected, and it lets an operator restart, skip or re-trigger the work that did not.
It is not a development or configuration interface. Pipelines are defined by metadata in the PDQ repository; the console reads that metadata and the runtime logs, and offers a small, bounded set of corrective actions on top of them.
All data is read through the PDQ REST API (with a few reference views reading the repository database directly). The console holds no state of its own.
Navigation map
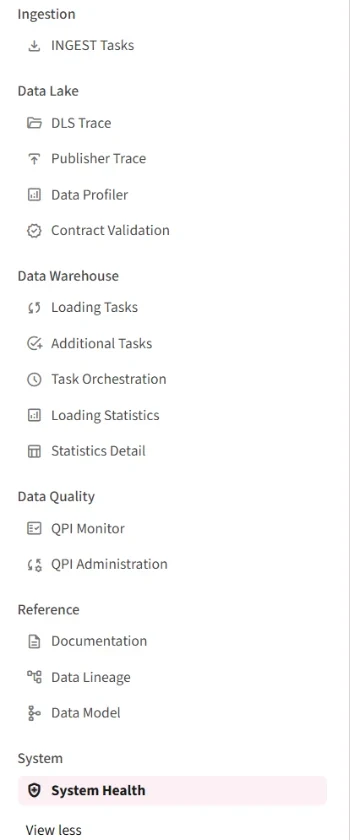
The sidebar groups the pages by the stage of the platform they cover.
| Group | Page | What it answers |
|---|---|---|
| Ingestion | INGEST Tasks | Did every scheduled extraction run, and how much did it bring back? |
| Data Lake | DLS Trace | Did every delivered file move through Landing → Raw → Trusted → Published? |
| Publisher Trace | Did each publish operation land in its destination table? | |
| Data Profiler | What does a delivery actually look like, and what contract does it imply? | |
| Contract Validation | Has a source drifted away from its agreed data contract? | |
| Data Warehouse | Loading Tasks | Did every load step complete for every sourcefile? |
| Additional Tasks | Did the post-processors chained onto the loads run? | |
| Task Orchestration | What is each sourcefile's schedule, and is it still healthy? | |
| Loading Statistics | How many rows were staged and inserted, by sourcefile and by object? | |
| Data Quality | QPI Monitor | What did each quality check most recently answer? |
| QPI Administration | Create, edit, retire and manually trigger quality checks. | |
| Reference | Documentation | The full configuration and data contract behind one sourcefile. |
| Data Lineage | Where does a column come from, and where does it end up? | |
| Data Model | How does the target model hang together? | |
| System | System Health | Are the services themselves running, and what did they log? |
System Health is the default landing page.
Global controls
Three controls in the sidebar apply to every page and are the first thing to check when a page looks empty or stale.
Date range
Pinned to the top of the sidebar. It sets global_date_range, which every time-windowed page reads.
- Quick presets: Today, 24h, 7 days
- A date-range picker plus separate From and To times (30-minute steps)
- The default on a fresh session is the last 24 hours
Pages that show "no data for the selected time range" are almost always answering correctly for a window that is too narrow — widen it before assuming a failure.

Platform health and refresh
A single coloured line under the date range summarises the whole platform for the selected window. Task Orchestration has its own, separate schedule status with a different scale:
| Indicator | Meaning |
|---|---|
| 🟢 All systems healthy | No failed jobs, no error or warning log entries |
| 🟠 n warning(s) | Error or warning entries in the runtime log, but no failed jobs |
| 🔴 Degraded — n job(s) failed | At least one job failed |
| ⚪ Health check unavailable | The health query could not be run |
The refresh button next to it clears every cache and re-reads the platform.
Settings
At the bottom of the sidebar, collapsed by default: the cache TTL. Query results are cached for 120 seconds by default, so two operators looking at the same window do not each hit the repository. Change it only if you need a different freshness/load trade-off; use the refresh button for a one-off reload.
Roles and permissions
The console does not authenticate users itself. It sits behind a Caddy reverse proxy that authenticates the user and forwards X-User-Email and X-User-Groups headers.
| Role | Derived from | In this console | In the Config UI |
|---|---|---|---|
admin | authp/admin group | Everything, including all restart / skip / trigger / edit actions | Write |
developer | authp/user group | Read every page — no admin actions | Write |
reader | Fallback when no group matches | Read every page | No write access |
The roles span two interfaces, and the difference matters: a developer has full write access
where the platform is configured, and cannot intervene in a running load. Read-only here does
not mean read-only everywhere.
The mapping itself is fixed at installation — the installer sets the GUID of an Entra group as the value of each internal group. See Role mapping.
Every mutating action lives inside an Admin console expander or an admin-only button. Non-admins see the panel replaced by a lock notice naming their current role.
The role headers are trustworthy only because the proxy sets them. Never expose the container port directly.
Audit log
Every user-submitted action writes one structured JSON line to stdout (captured by the container logs), recording who did it, their role, the page, the action, the target and the timestamp — for example a restart of failed INGEST tasks, a re-publish, a schedule change or a QPI termination.
Error handling
Repository failures do not blank a page. Each page wraps its fetches so that a failure is rendered as an actionable card describing what failed and whether it is retryable, while the sections that did load still render. On System Health, identical failures across several endpoints are de-duplicated into a single card.
The daily pass
The routine itself is documented once, in The daily pass — the order to work in, what each check is looking for, and what to do when one fails.
What this section adds is where each page carries its own checklist, at the bottom, comparing configured against executed. That comparison is the fastest way to spot work that never started at all — a silent failure that a "no failures" metric will not reveal.