Data Warehouse
Four pages covering DWA — the metadata-driven service that loads the integrated data model from the files in the lake. This is the heart of the platform, and where most operator intervention happens.
Loading Tasks
The main warehouse monitor: did every load step complete for every sourcefile?
The task grid is scoped to the sidebar date range. The Failed tasks and Tasks still in progress sections are deliberately not — they always read the latest execution, so an active problem cannot be hidden by a narrow window.
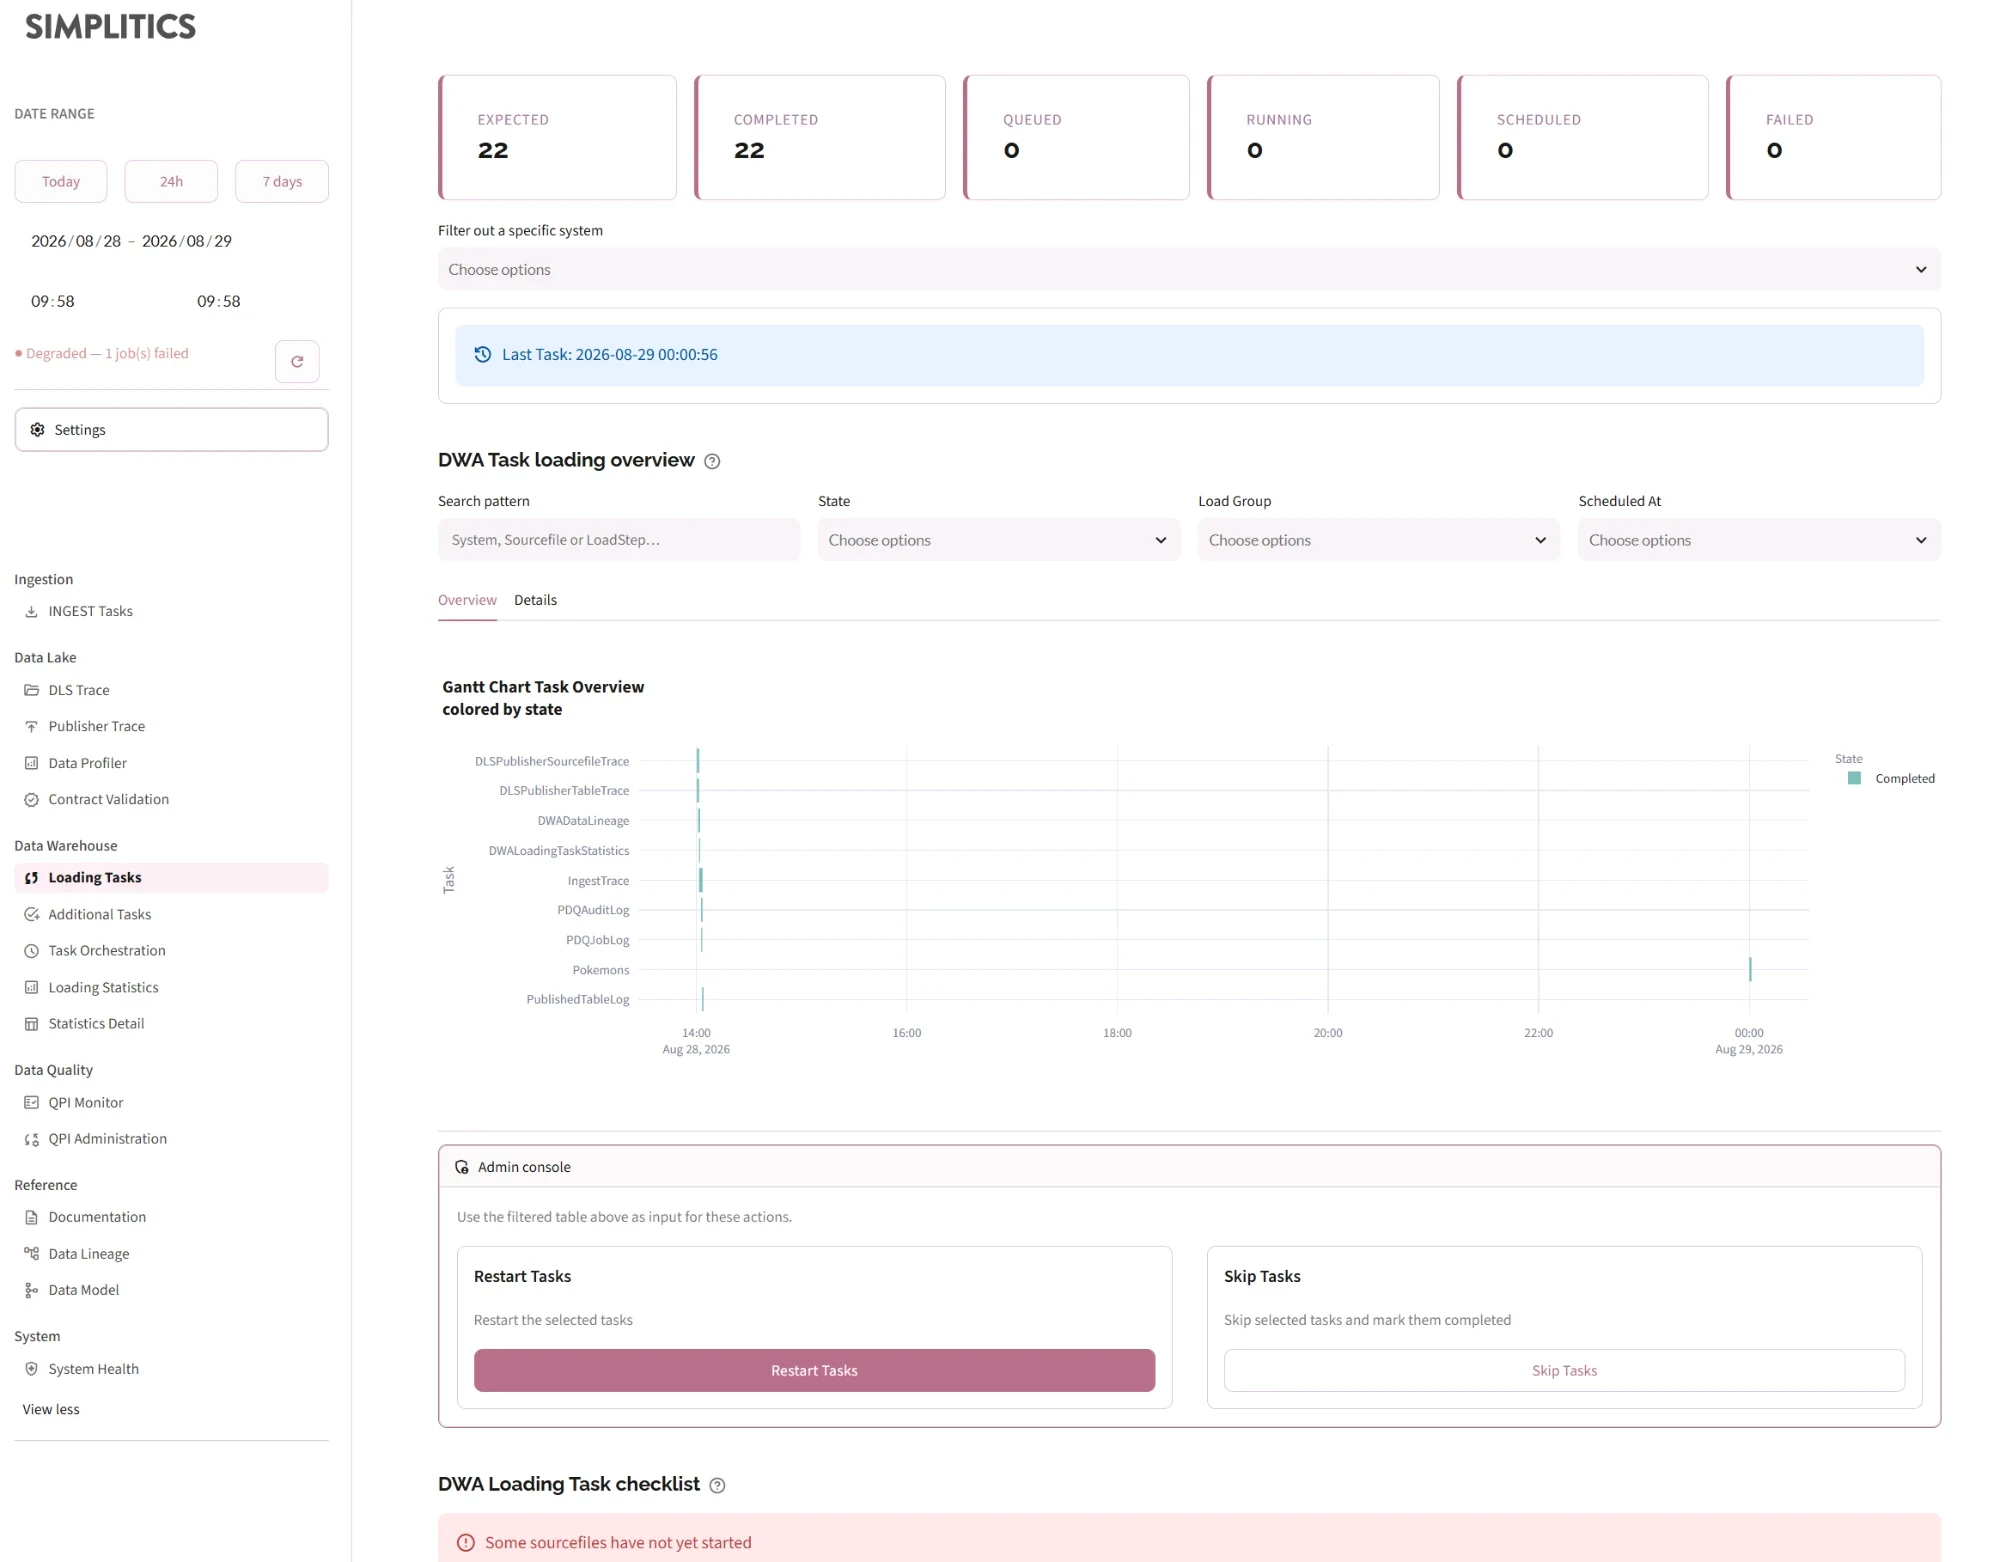
State metrics and system filter
The standard counter row — Expected, Completed, Queued, Running, Scheduled, Failed — followed by a single-system filter, and a Last Task panel showing the most recent start time in the window.

Failed tasks
Failures are grouped by extracted error text, not listed individually. The console pulls the core exception out of each error message, groups on it, and renders one expander per distinct cause showing the affected Sourcefile / ExecutionDateTime / LoadStep rows and the full error.
Two bulk actions apply to all listed failures, behind an explicit confirmation:
| Action | What it does |
|---|---|
| Restart | Per sourcefile. The API discovers the active run and re-schedules every step not yet Completed. |
| Skip | Per step, matched on Sourcefile + ExecutionDateTime + LoadStep. Marks each Completed without running it. |
DWA loading tasks are idempotent — rerunning one cannot duplicate or corrupt data. Restarting a failed load is the standard first move, not a last resort. Skip is the exception: it declares work done that never ran, so use it only when you know the data is not needed.
Tasks still in progress
A coloured bar chart of incomplete work by sourcefile and state, then a selectable table. Filter by state, select the rows you want, choose Restart or Skip, and confirm. Unlike the Failed section this acts on your selection only.
DWA Task loading overview
Fast filters — search (System, Sourcefile or LoadStep), State, Load Group, Scheduled At — feeding two tabs:
- Overview — a Gantt chart of every step, when it ran and how long it took
- Details — the same rows as a table, with millisecond execution timestamps
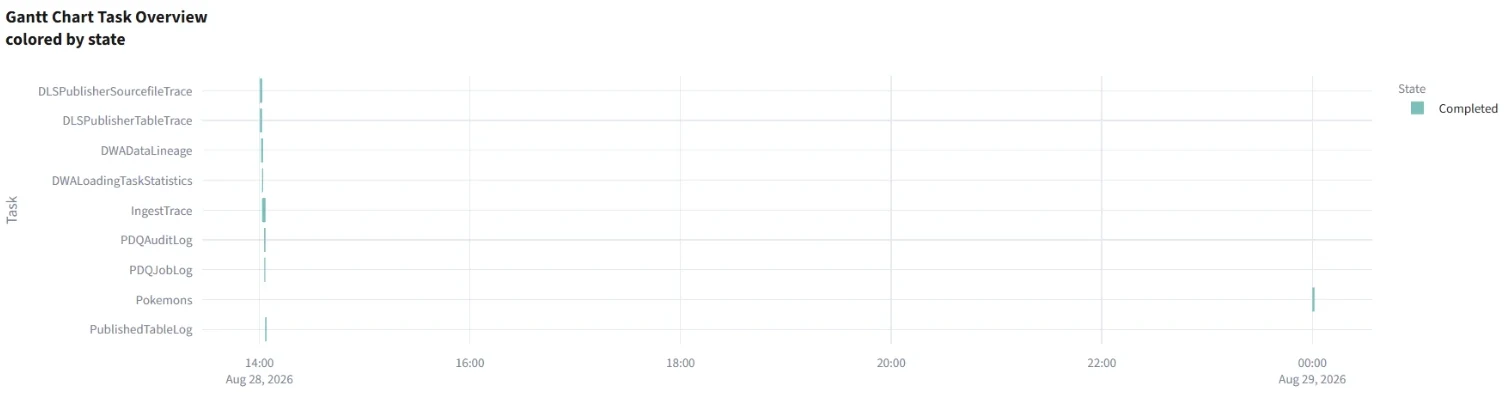
Admin console
Admin only. Restart Tasks or Skip Tasks applied to everything in the filtered view. Both audit-logged.
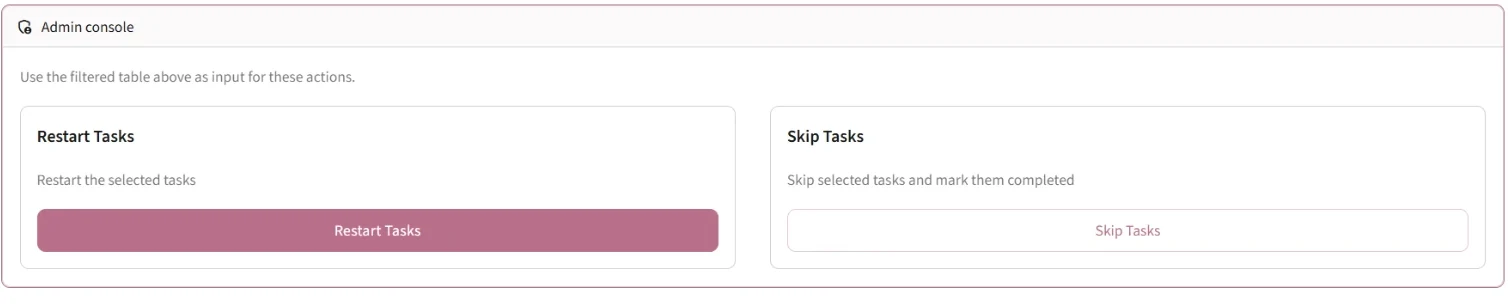
DWA Loading Task checklist
Every scheduled sourcefile against what actually started. Columns: sourcefile, a readable schedule ("Every 2 hours", "On file arrival"), executed flag, still-in-progress flag, last execution, next scheduled execution. Rows that never started are highlighted, and the expander opens automatically when any are found.
Additional Tasks
Post-processors — extra processing that can be hooked onto the standard loading flows. Same shape as the loading page, with the dependency structure made explicit.
- Time Window / Last Task — the span from first start to last finish. A span over 25 hours is flagged red as lagging.
- State metrics — the standard counter row
- Filter by source system — narrows the chart and checklist by processor type
Two tabs: a Timeline (Gantt) with zoom presets (1d, 1w, 1m, 6m, YTD, 1y, all, defaulting to today), and a Task Detail table with a filter builder.
Incomplete workloads
Read from a dedicated status endpoint, so it covers every outstanding task regardless of the record limit above. An overview bar chart by state, a details pane with per-processor restart buttons, and a full incomplete-task table.
Checklist and dependency graph
The checklist lists every configured post-processor, its dependencies and its run command, with an executed flag. Selecting a row reveals the full run command as SQL.
Below it, a left-to-right dependency graph: arrows show execution order, a processor runs once its dependencies have. Nodes are coloured by whether they are a processor in their own right or an external dependency, and rank is derived from the dependency chain — so a processor another processor waits on sits to its left.
Task Orchestration
The schedule editor. Where the other DWA pages show what ran, this shows what is meant to run, and lets an admin change it.
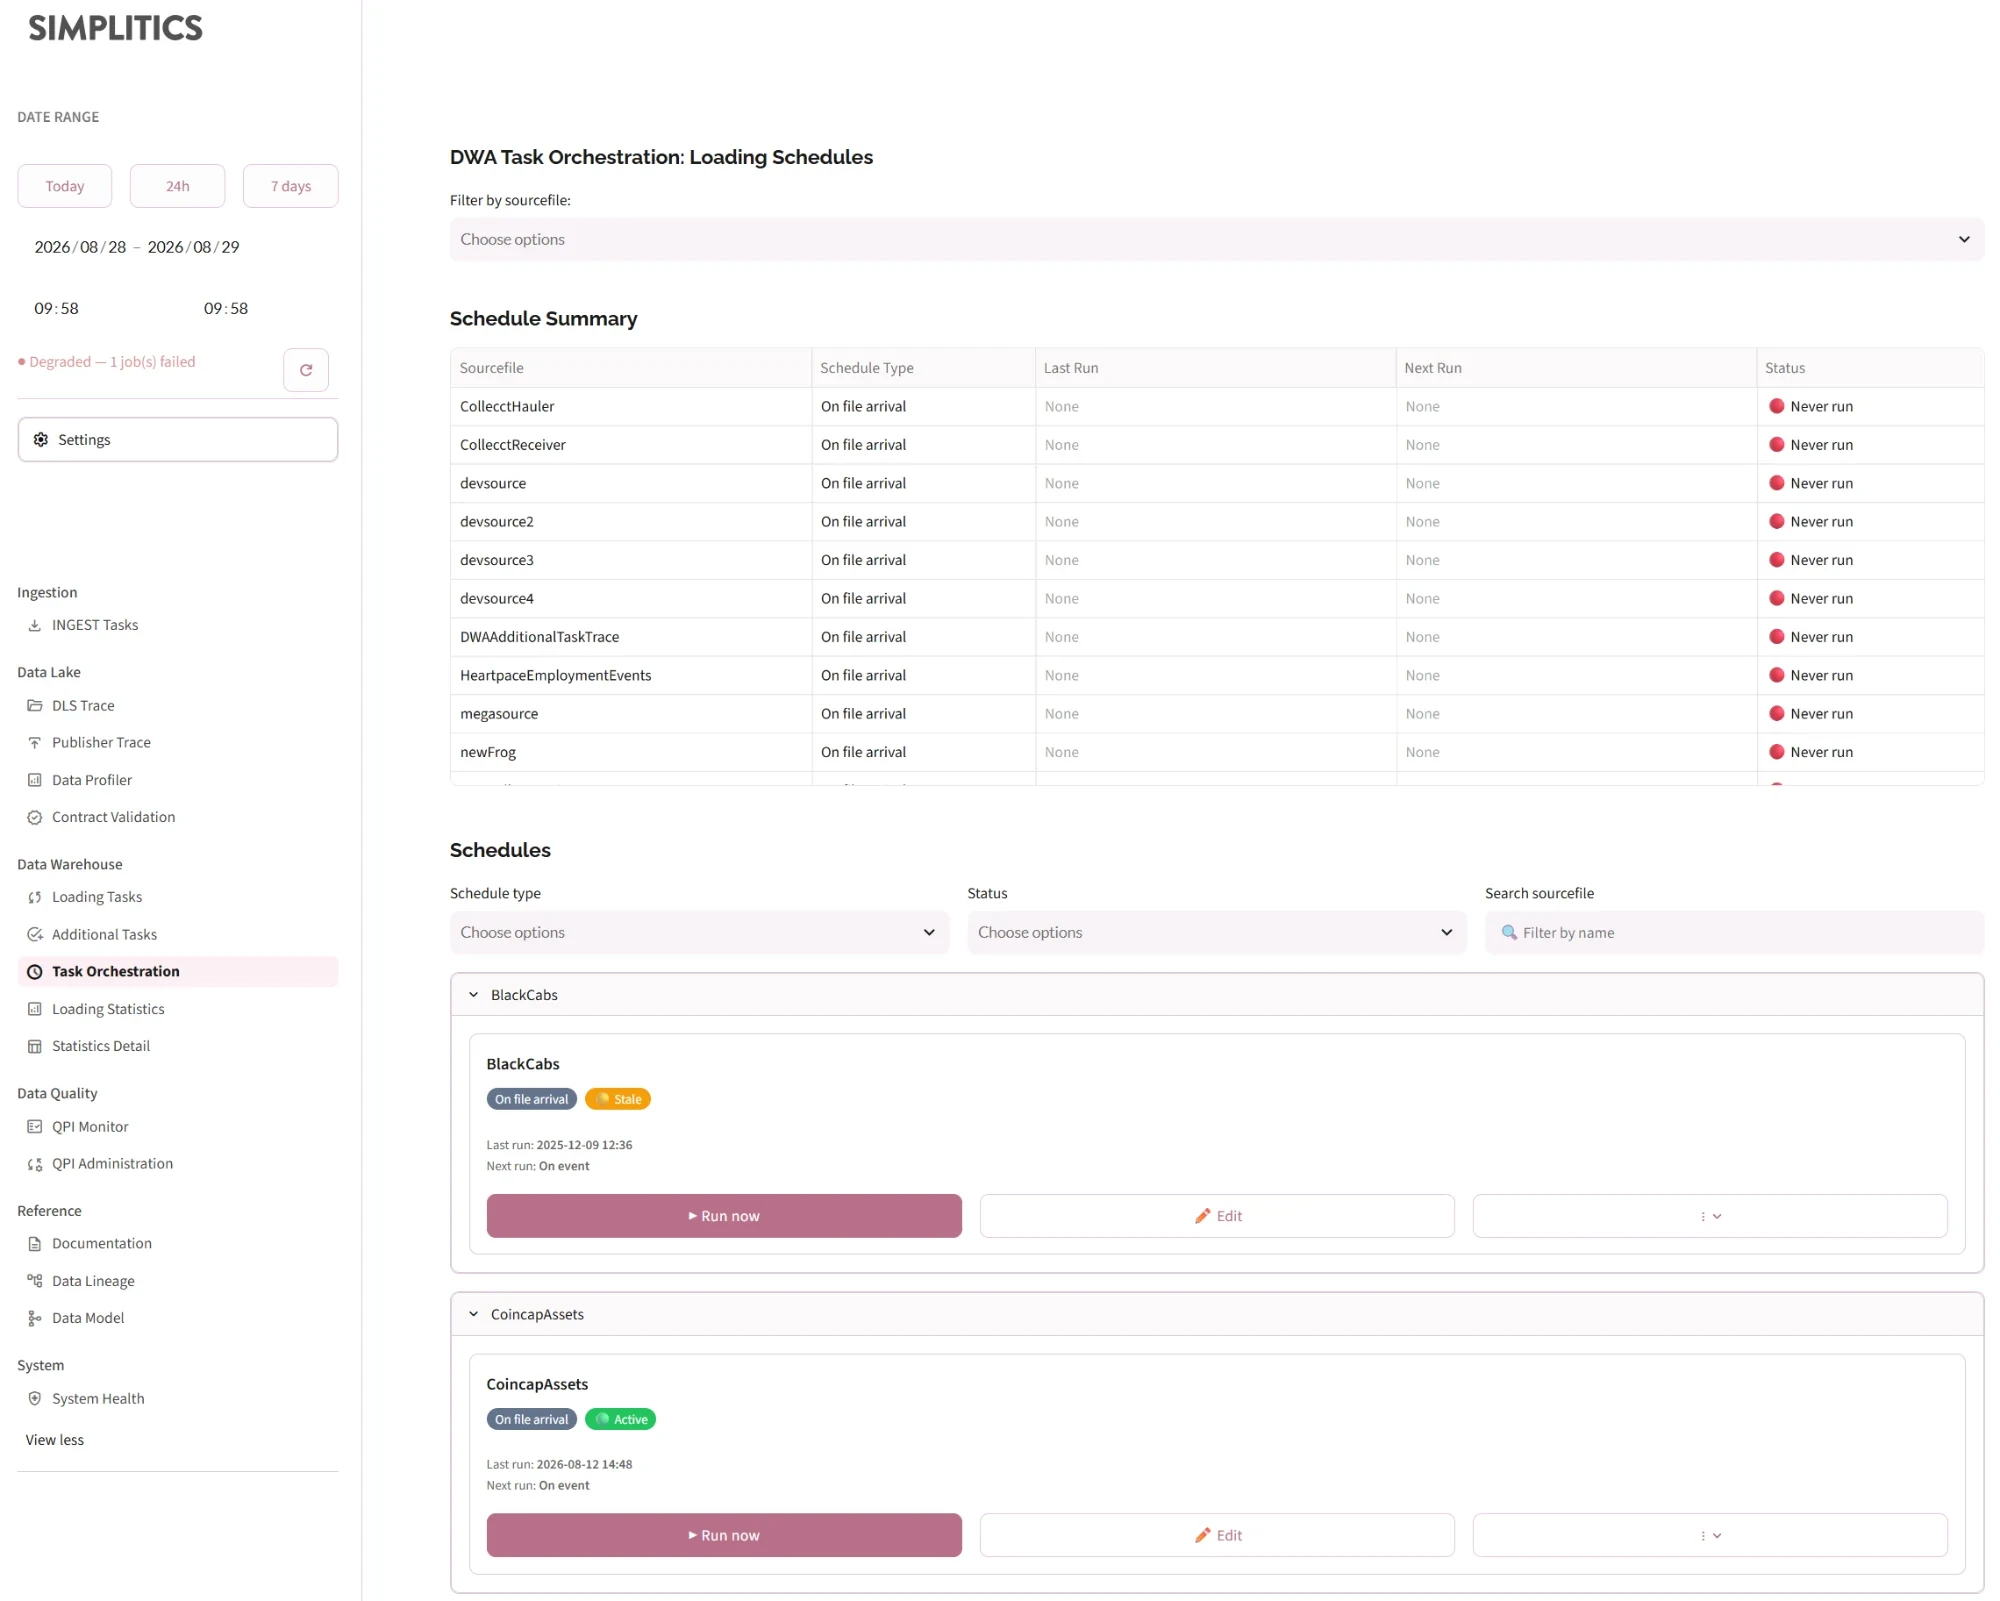
Schedule Summary
A sortable table of every sourcefile: schedule type, last run, next run, status — sorted oldest-run first, so anything neglected floats to the top.
Schedule status
Evaluated per schedule, in order. This is a different scale from the platform health line in the sidebar, which summarises the whole installation — the two use coloured dots that mean different things:
| Status | Rule |
|---|---|
| 🔴 Never run | No last-run timestamp |
| 🟡 Stale | Last run more than 30 days ago |
| ⚪ Config error | Not On file arrival, but no next run computed |
| 🟢 Active | Everything else |
Config error is the one to act on. A recurring schedule with no next execution will never fire again — it is broken, not idle.
Schedule cards
Below the summary, one card per sourcefile, grouped into expanders by source-system prefix, with filters for schedule type, status and name. Each card shows the type badge (On file arrival, Hourly, Daily, Weekly, Monthly), the health badge, the interval, and last/next run.
Three actions per card, all admin-only and all confirmed inline:
| Action | Effect |
|---|---|
| ▶ Run now | Triggers a run immediately |
| ✏️ Edit | Opens a form below the card row: schedule type, interval, earliest run time of day |
| ⋮ → ⏹ Disable | Unschedules the sourcefile by setting its validity to end now |
Disable is tucked inside a popover specifically to prevent accidental clicks. All three are audit-logged.
Loading Statistics
Volume analysis. Where the loading pages answer did it run, this answers how much did it move.
Sidebar filters — Sourcefile, Filekey, Object, Attribute — combine with the global date range, with an active-filter count and a Clear all filters button. The page auto-refreshes on the cache TTL and offers a manual Refresh.
Two tabs:
By sourcefile
KPIs: sourcefiles, total stages, executions, rows loaded. Below them an interactive pivot table — choose your measures (insertCount, stageCount), with totals, subtotals and drill-down. The detail expander offers a CSV export and a selector that jumps straight to the detail page for one sourcefile.
By object
KPIs: objects, unique sources, total rows inserted, executions, with its own pivot table pivoting on object, plus CSV export.
Statistics Detail
The drill-down for a single sourcefile, reachable from the sourcefile tab or directly. Enter a sourcefile name (optionally an exact execution time) to get:
- KPIs: executions, total stages, objects loaded, total rows inserted
- Execution timeline — stages per execution over time
stageCount and total stages count the load steps a run executed. The name predates the
retirement of Stage as a model tier and still appears in the product, so it is kept here as the
console spells it. See the model chain.
- Rows inserted by object — stacked by attribute where available
- Tables by sourcefile and by object, each with CSV export
A sourcefile whose row count drops sharply between executions, or whose stage count climbs while insert counts stay flat, shows up here long before it shows up as a failure anywhere else.